top
First, run the top command (copy and paste, hit enter):
top
Your load should be less than 1.00 X the number of CPU cores of your server. For example, if you have a two CPU core server, your load should generally be below 2.00.
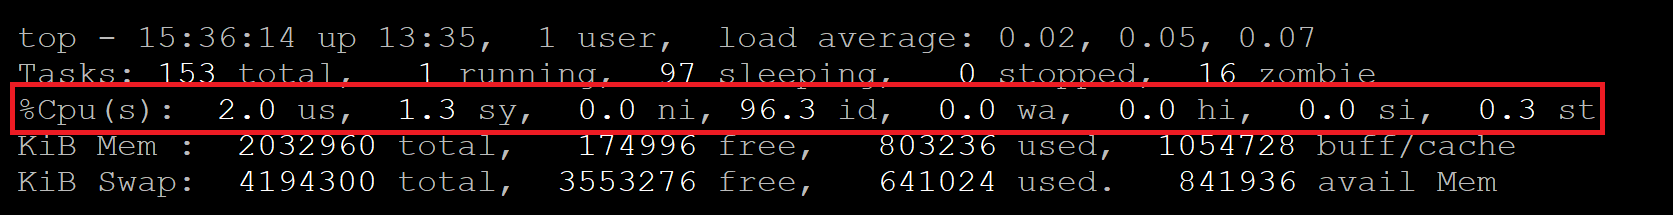
Additionally, if top shows 50% or more in id (idle) resources, then your server is healthy, and you should be looking within the site for errors and code bottlenecks.
All of the metrics you’ll see in top are in the form of percentages. 100% equals 1 CPU core of the server. For example, if you see MySQL taking up 200% and you have a 2 CPU core server, SQL would be taking up all of your CPU resources.
CPU Steal
On the right of the highlighted section in the screenshot above, you can see a metric marked “st“. This stands for “steal”, and if your seeing a high percentage of steal, you should contact your server provider as it means that someone else’s VPS is infringing on your resources.
PHP Processes
You may see many PHP processes overwhelming your server. If you do, it may mean that a site needs to have its number of PHP workers lowered to maintain server stability, or it may mean a plugin is misbehaving and looping.
You can exit top with Q or CTRL+C.
Here’s a more detailed guide on the top command:
How to use the top command to monitor system processes and resource usage
htop
top and htop cover a lot of the same information, but htop can make it easier to assess CPU usage and the active processes on your server.
You can usehtop with:
htop
You can exit htop with Q or CTRL+C.
Learn more about htop in this article:
How to use the htop command to monitor system processes and resource usage