Introduction
MySQL slow query logging can be a highly useful tool for uncovering performance bottlenecks in your websites.
The MySQL slow query log is where the MySQL database server will log all queries that exceed a time (in seconds) that you specify. This can be particularly helpful on database-intensive websites, such as WooCommerce stores, to help identify long-running processes, so that you can set about fixing them for better performance.
Table of Contents
Background Information
MySQL slow query logging is a simple debugging tool, and can be a great place to start if you’re experiencing performance issues on one or more of your websites.
Both the GridPane Nginx and OpenLiteSpeed stacks are incredibly performant for hosting WordPress, so when used with excellent hardware (high-frequency servers like Vultr HF), the last remaining place to optimize is your website’s codebase.
Used in conjunction with the PHP Slow Log and Query Monitor plugin, you can uncover a great deal of information about the requests and SQL queries your website runs, where you may have bottlenecks, and where to begin improving your codebase.
Common issues include a lack of indexing which can dramatically slow your website down as your database grows in size (MySQL may be scanning your entire database row by row if your data isn’t properly indexed). Your plugins may also be inefficiently querying MySQL.
Activating/Deactivating the MySQL Slow Log in the UI
The MySQL slow log is available in the UI on Developer and Agency plans. Please see the section below on how to activate it via the command line on other plans.
STEP 1. TURN ON SLOW QUERY LOGGING
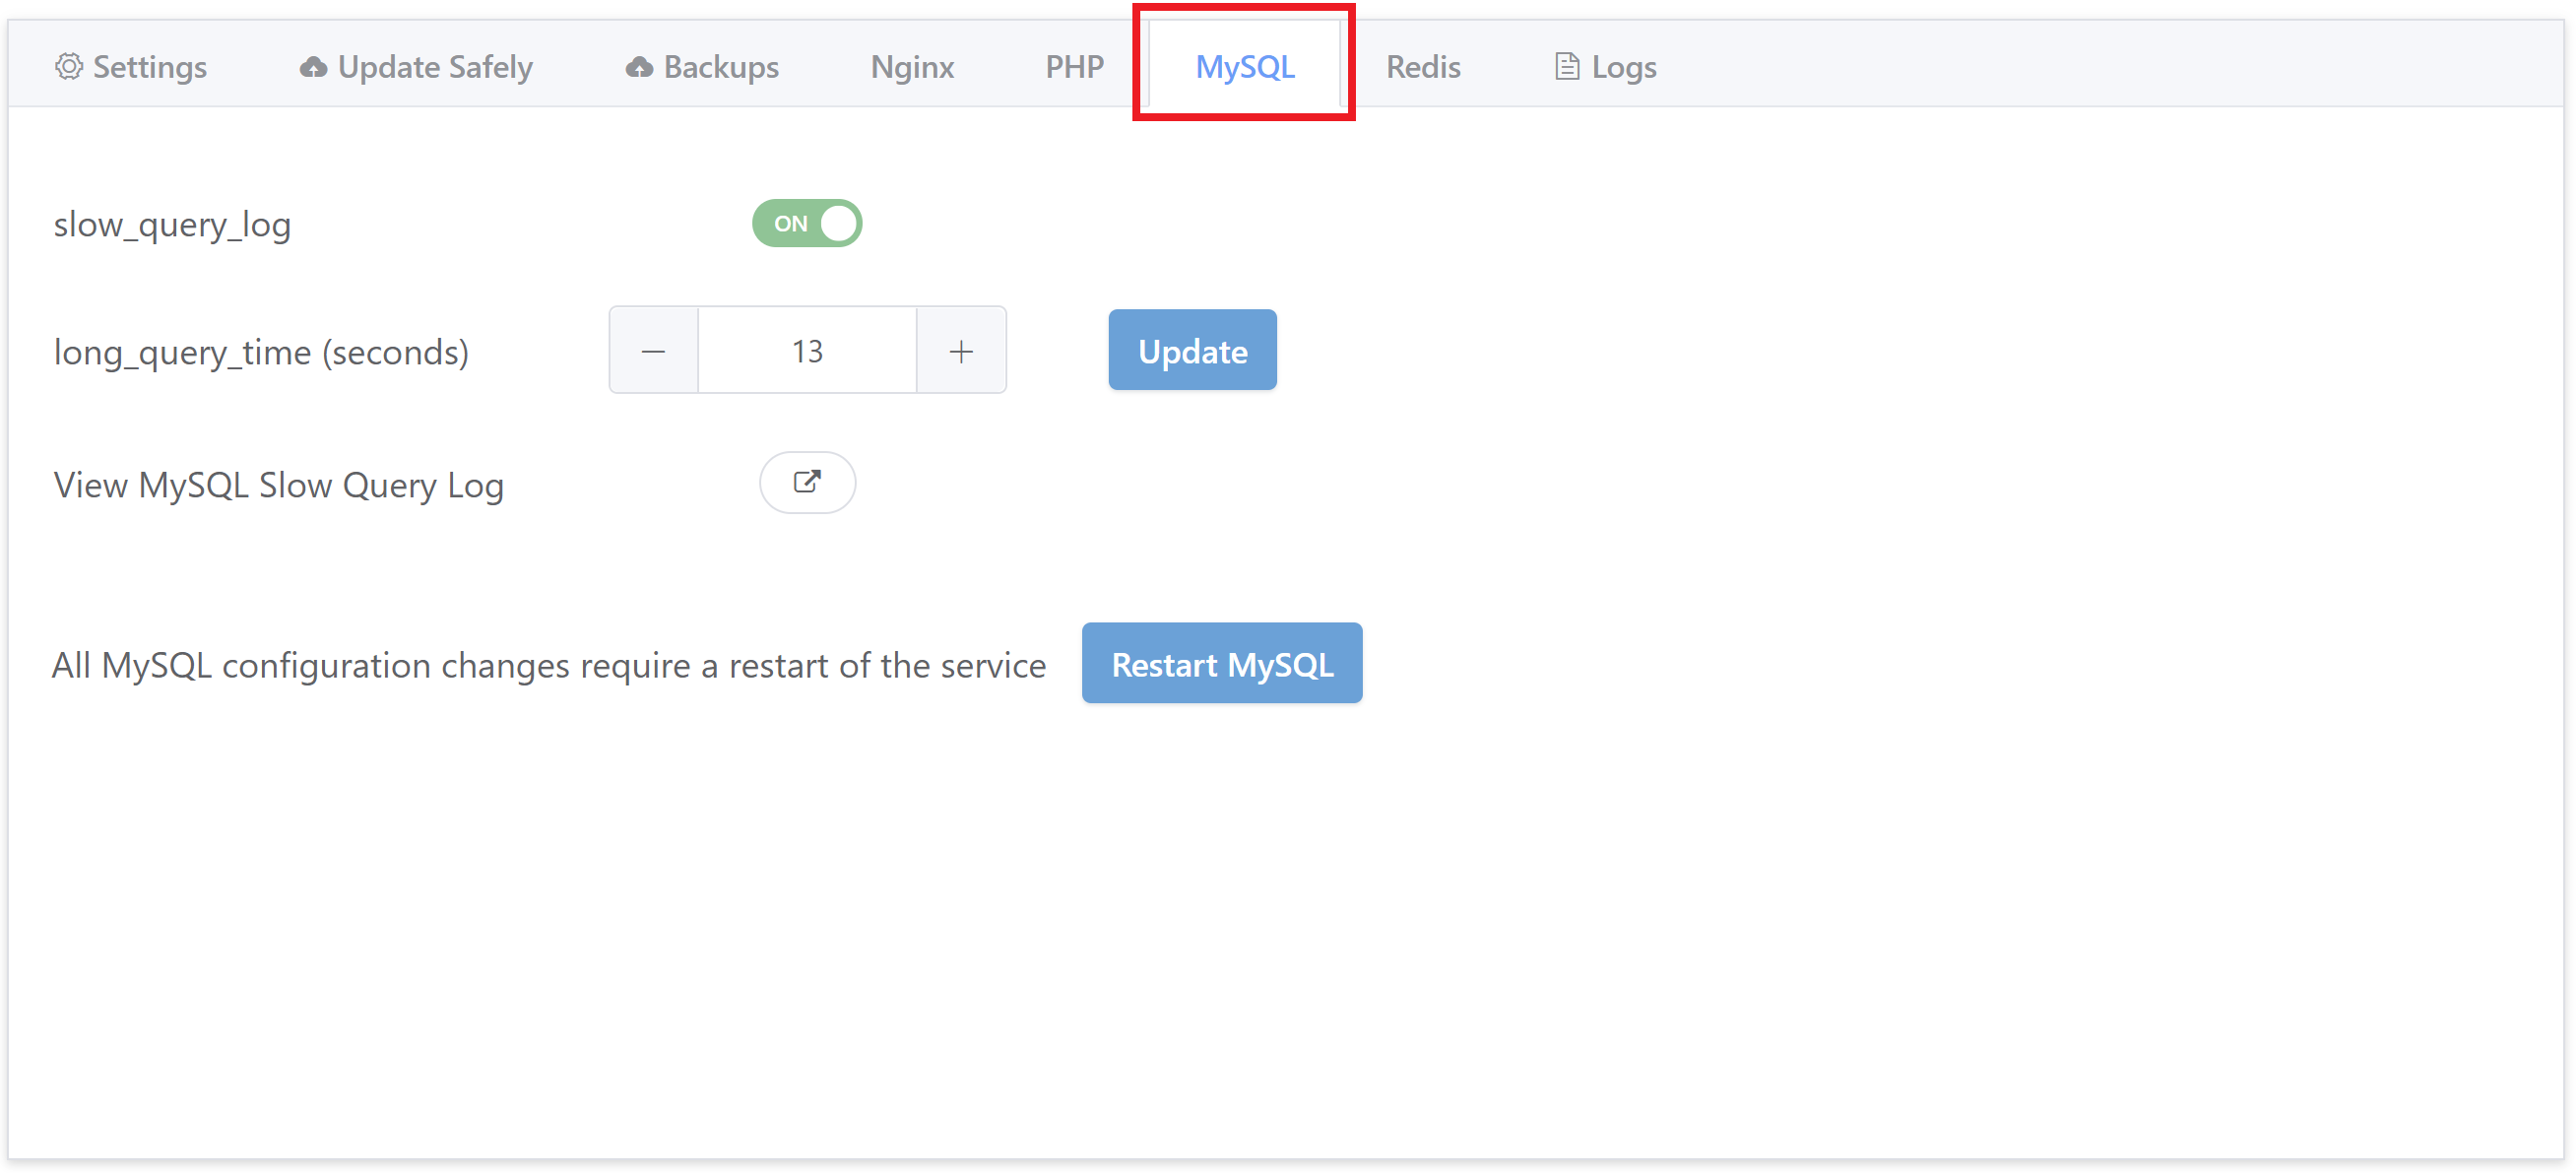
The MySQL slow log is also located within the Server customizer inside the MySQL tab:

Toggle “slow_query_log” to ON.
STEP 2. SET THE TIME
Next, set the minimum time that you want queries to have to exceed to be logged in the “long_query_time (seconds)” settings of the MySQL tab.
STEP 3. RESTART MYSQL
To make your changes take effect, hit the Restart MySQL button.
STEP 4. CHECK YOUR LOGS
Depending on how busy your website is, it may take some time to gather information, but this will vary on a website by website basis.
SLOW LOG SERVER LOCATION
The log can be found here when accessing your server via SSH or SFTP as the Root user:
/var/log/mysql/slow.log
Important
Always deactivate the MySQL slow log once you've completed your debug.
Manually Using the MySQL Slow Log
The MySQL slow query log is available to all plans, but only directly inside the UI on Developer and Agency accounts.
Here’s how to activate and use it via the command line.
Activation/Deactivation
For Pro and Panel users, you can activate MySQL slow logging with the following:
gp stack mysql -slow-query-log 1
And you can deactivate it with:
gp stack mysql -long-query-time 0
Slow Log Settings
You can set the minimum time that you want queries to have to exceed to be logged with:
gp stack mysql -long-query-time {accepted.value}
The value is in seconds. For example, for 10 seconds with:
gp stack mysql -long-query-time 10
Restart MySQL
Once you’ve set the long-query-time, restart MySQL with:
gp mysql restart
View the Log
You can view the MySQL slow log with:
cat /var/log/mysql/slow.log
Important
Always deactivate the MySQL slow log once you've completed your debug.
Reading the MySQL Slow Log
On Developer and above you can view the log directly inside your GridPane account. Other accounts will need to cat the log on the command line.
The slow log will display any queries that exceed the threshold that you set as the “long_query_time“.
Here you’ll find the query as well as additional information such as the timestamp, time the query took to process, number of rows queried etc.
You can use this information alongside your access logs and PHP slow logs to implement fixes for the inefficiencies you find for better performance.
Additional Resources
The MySQL slow log is just one of the resources available to you for troubleshooting performance-related issues. The following features and guides may also be beneficial:
- Using the PHP Slow Log
- WordPress Debug and Query Monitor
- Diagnosing Performance Issues and 504 Timeouts
- Diagnosing 502 Errors
You could also install an Application Monitoring tool:
