Diagnosing 502 Errors

9 min read

Table of Contents

IMPORTANT

If PHP and Nginx are not down, this is not a server stack issue. If other websites on your server are not experiencing 502s, then the problem is almost certainly in your code base (theme/plugin).

About 502 Errors

502s occur when there’s a disconnect between Nginx and PHP. When these happen, you’ll notice that your browser appears to be continually loading before eventually returning a 502 Bad Gateway error.

This happens because the browser being kept alive by Nginx, while Nginx is waiting for a response from the PHP-FPM server. When PHP-FPM doesn’t send back a response within the time-frame that Nginx allows for, it closes the connection and returns a 502.

Common Causes

There could be a few reasons for this:

  • Excessive Database Table Locking
  • PHP is down or has been restarted and is still in the process of booting backup
  • Long-running PHP requests or long-running MySQL requests that hold up PHP
  • High server load or noisy neighbours slowing your VPS down
  • There’s an issue with your DNS resolution
  • There’s an issue with Cloudflare
  • Possibly an attack – though this with you would notice long wait times and all the sites on your server would likely feel slow and unresponsive.

This can be a difficult one to diagnose as 502s can be irregular or one-off events. Or they can be the result of database locking, or continuous long-running PHP requests from a plugin gone rogue, or PHP conflicts/errors.

PHP may or may not be showing high CPU usage when these errors occur. It varies depending on the root cause.

Plugin Examples

One plugin we’ve seen at the root cause of 502 errors recently is Blogvault. Normally it’s fine, but we’ve seen long-running PHP requests resulted in 502 errors. In one case all requests at load.php were being lost due to a PHP issue caused by Blogvault. This was happening so early in the loop that the rest of the site never got a chance to load. Disabling Blogvault brought the site back to life immediately.

Site note: We’ve also seen Blogvault cause database table locking and 504 timeout errors.

I’ve personally also experienced this once with Wordfence, though it was only a one time, random event, and that was almost 2 years ago now.

Below we’ll look at the steps to begin identifying the root cause of your 502 issues.

Step 1. Check PHP via Monit

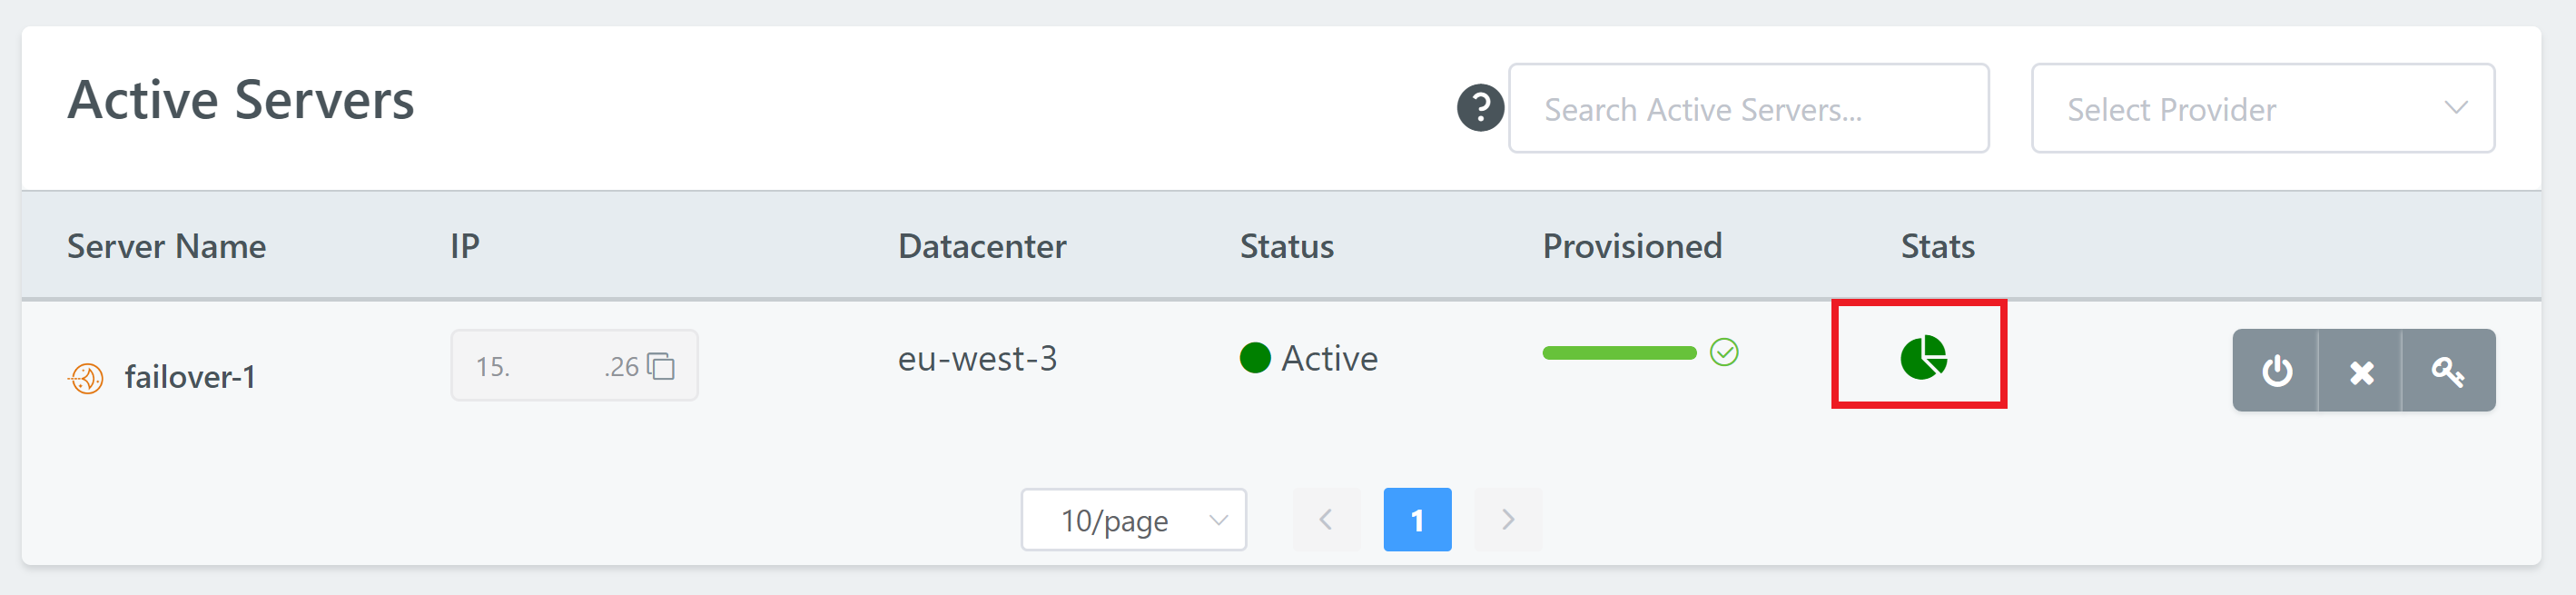
First, head to your Servers page in your account and open up Monit for the server you’re having trouble with by clicking on the pie chart icon:

Under processes, is your websites PHP version status “OK“? If it’s anything else then PHP is likely down and this is the root cause of the issue you’re facing.

Here’s a healthy Monit example:

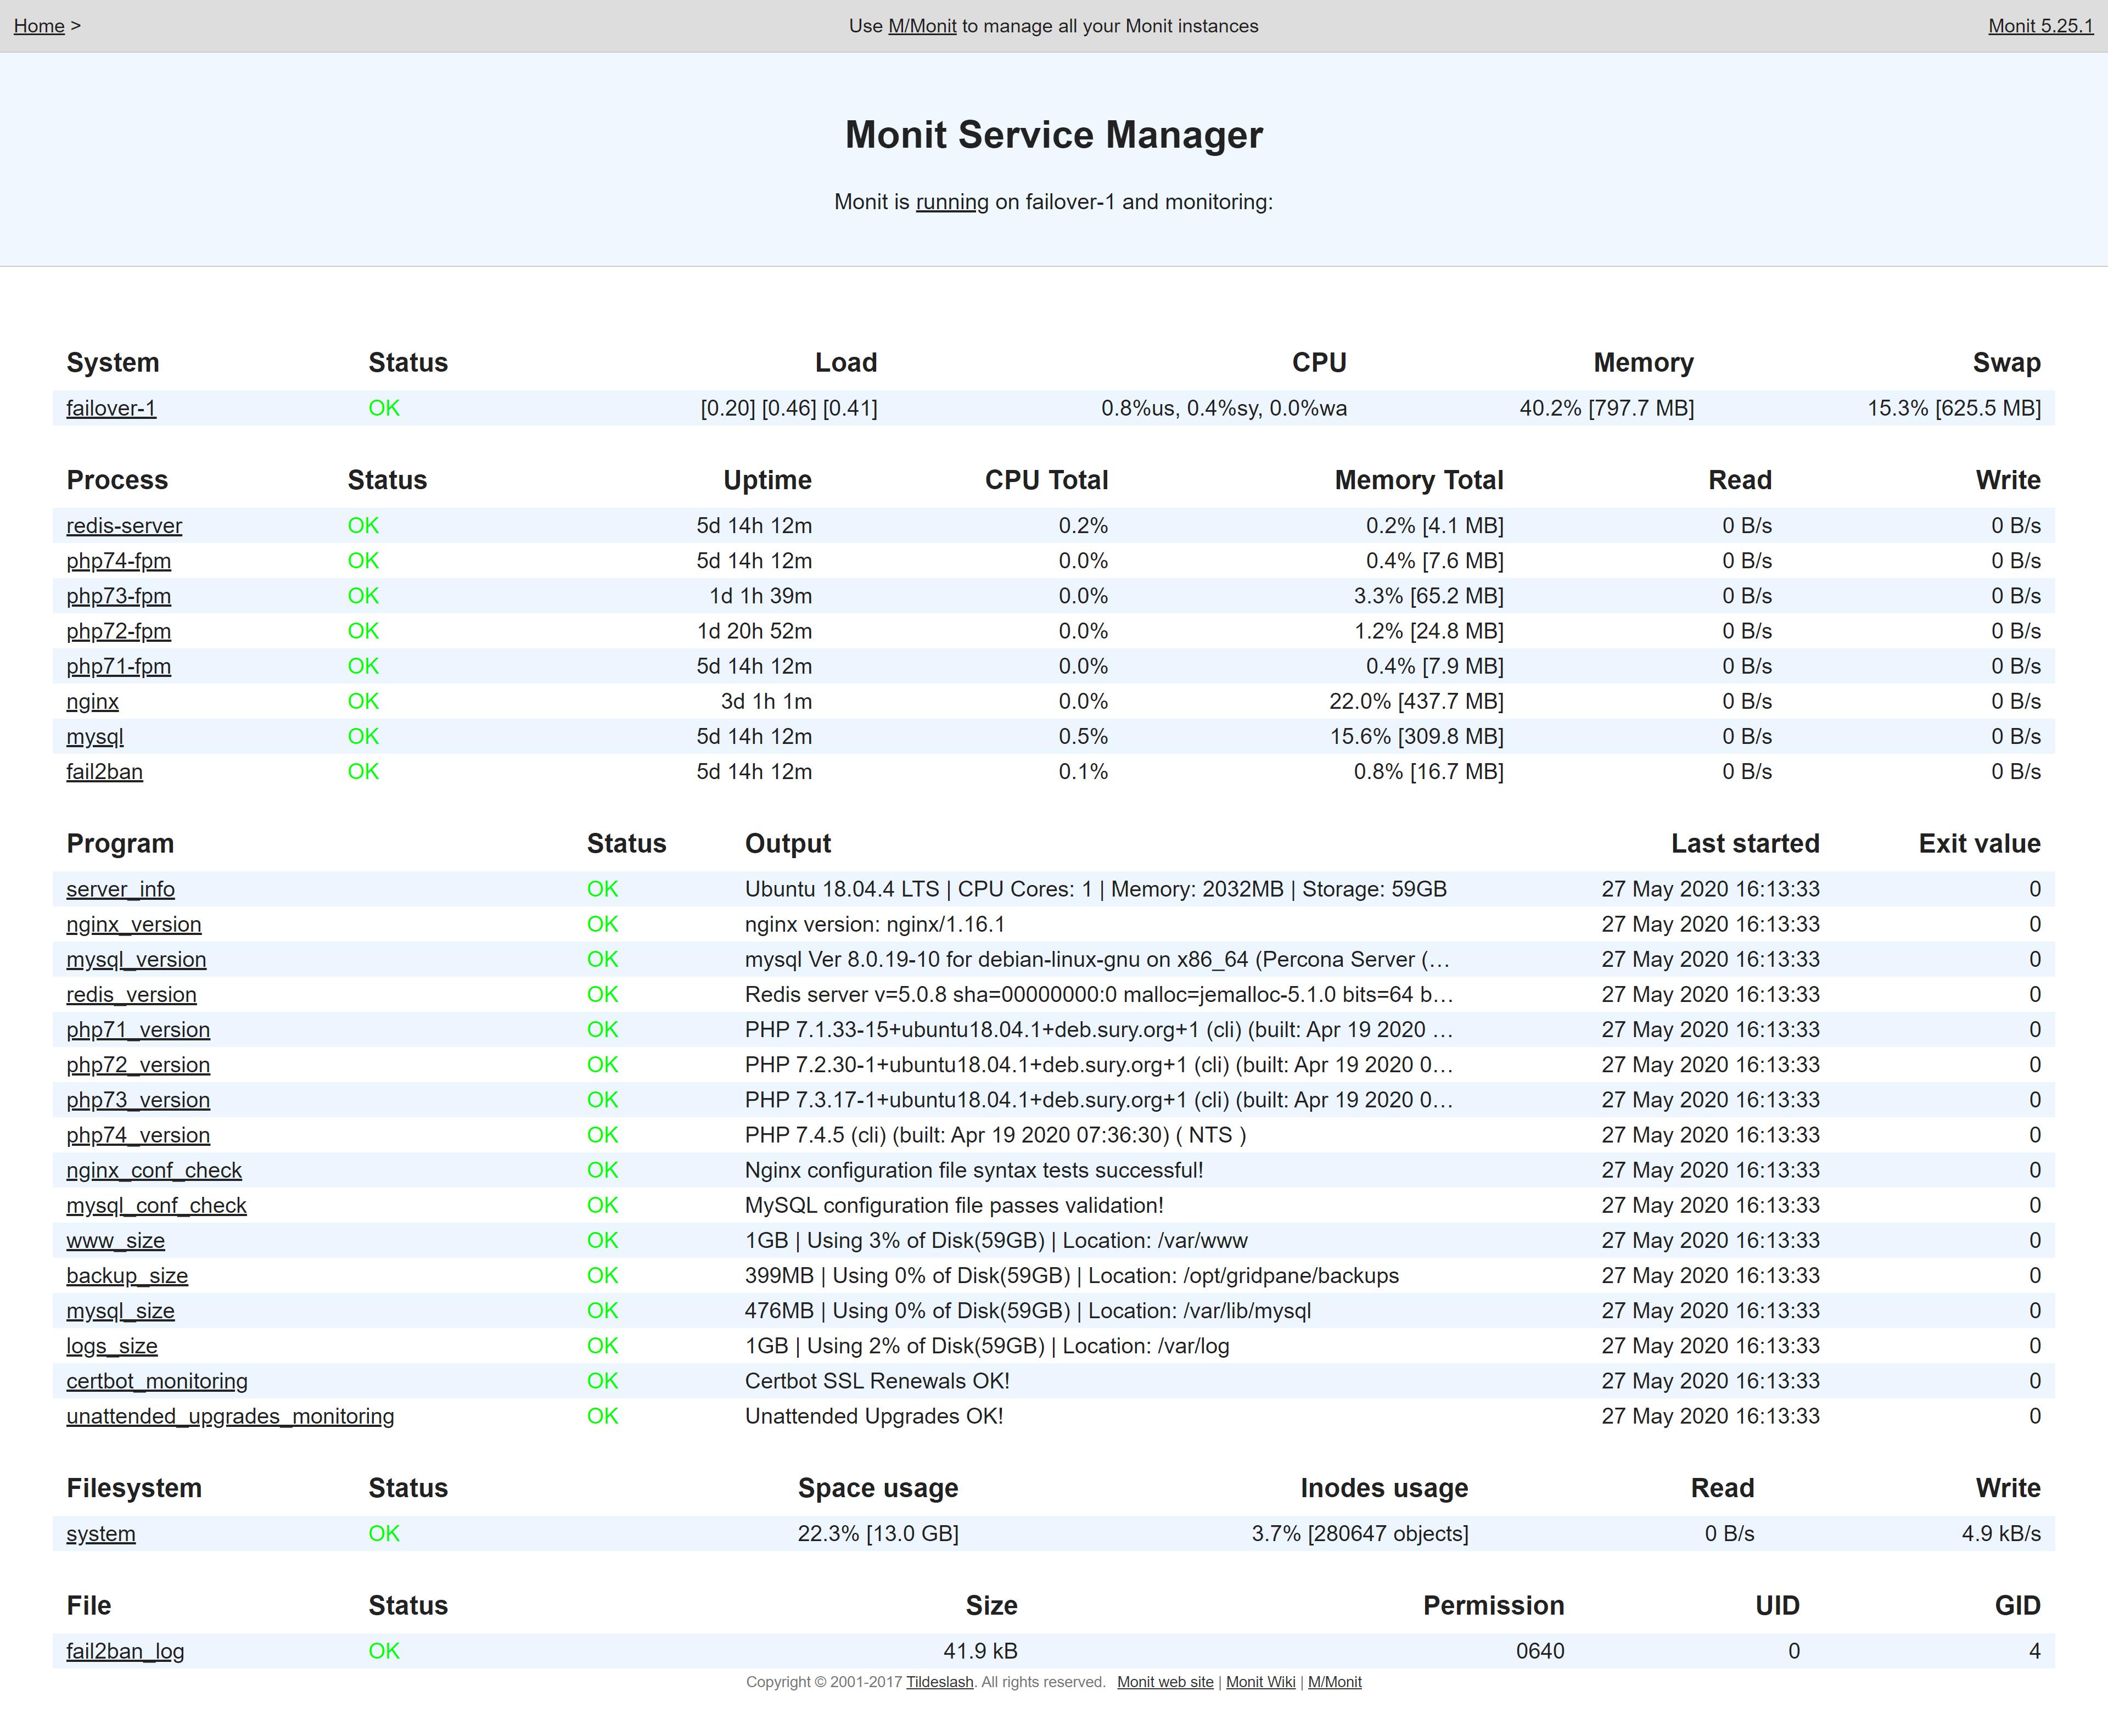
Monit will tell you a lot about what’s going on inside your server. If PHP or MySQL are using a lot of memory and/or CPU, then it’s likely that you have an issue with a plugin.

CPU Usage is High, but MySQL/PHP CPU Usage is Low

If your CPU usage is high, but neither PHP nor MySQL is responsible, then you may be suffering from either high server load or noisy neighbours. 

If this is the case, proceed to step 5.

If Nginx CPU usage is high, this could be sign of a malware infection or significantly high traffic (which could include a DoS or DDoS attack).

If this is the case, also proceed to step 5.

Step 2. Check Your DNS Resolution and Cloudflare (if applicable)

Head over to: https://dnschecker.org/#A

Paste in your URL and check that your DNS is resolving correctly. If it is, move on to Cloudflare below (if applicable), or on to step 3.

Cloudflare

If you’re using Cloudflare’s proxy service (orange clouds) and not just their DNS service (grey clouds), you may want to quickly check if turning off their services fixes the issue for you.

It’s extremely rare, but we have seen instances where there was an issue with Cloudflare in a specific region for a client, but the site worked fine for our whole support team.

Step 3. Check your Nginx Error Log

Your Nginx Error Log will very likely contain a clue as to what’s going on, and may help identify the specific process responsible. If you have an ongoing 502 error, this is the next place to check.

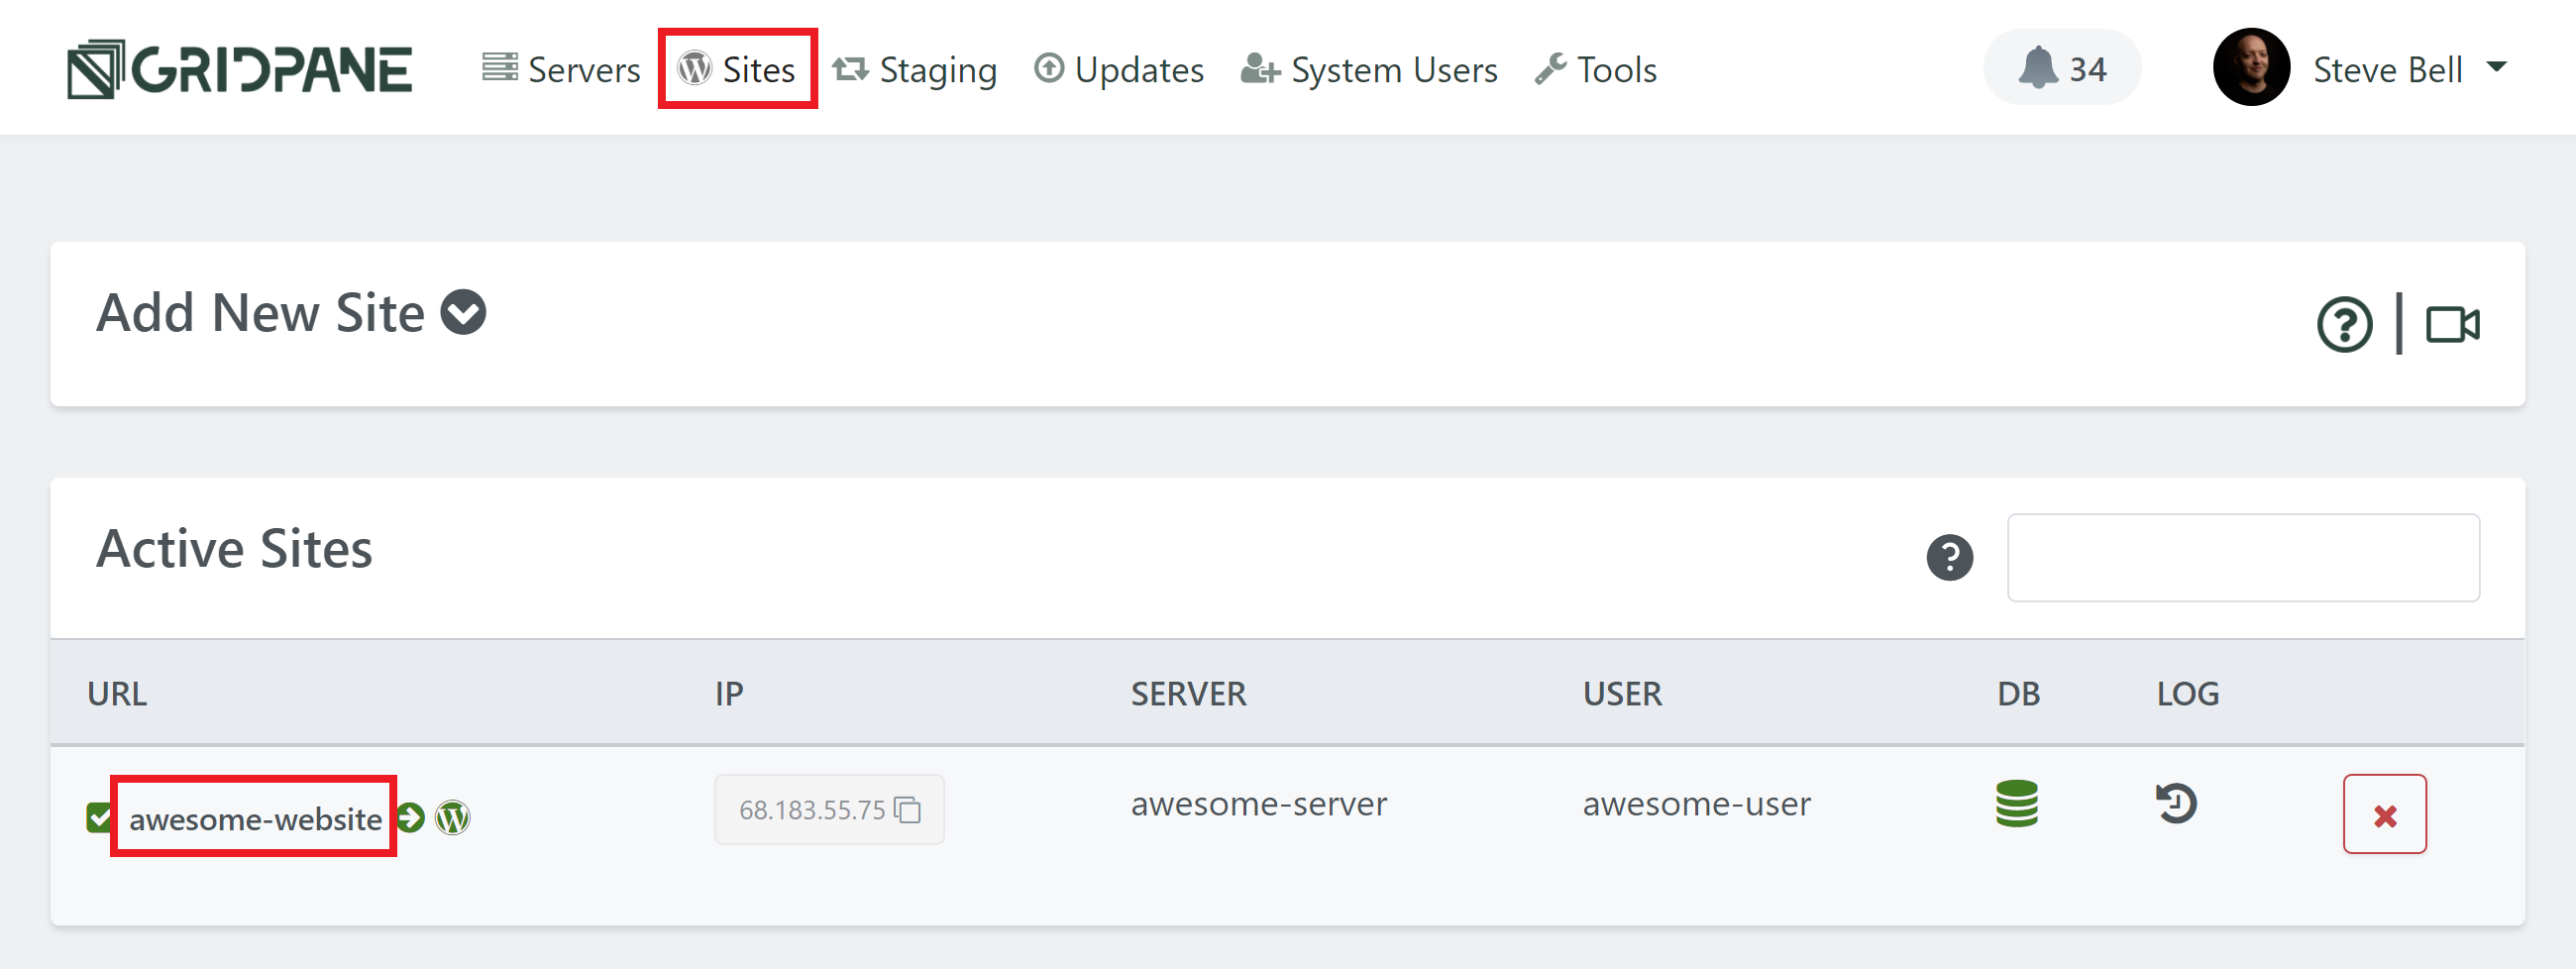
You can find your website’s error log by heading to the Sites page inside your GridPane account and clicking on your website’s domain name:

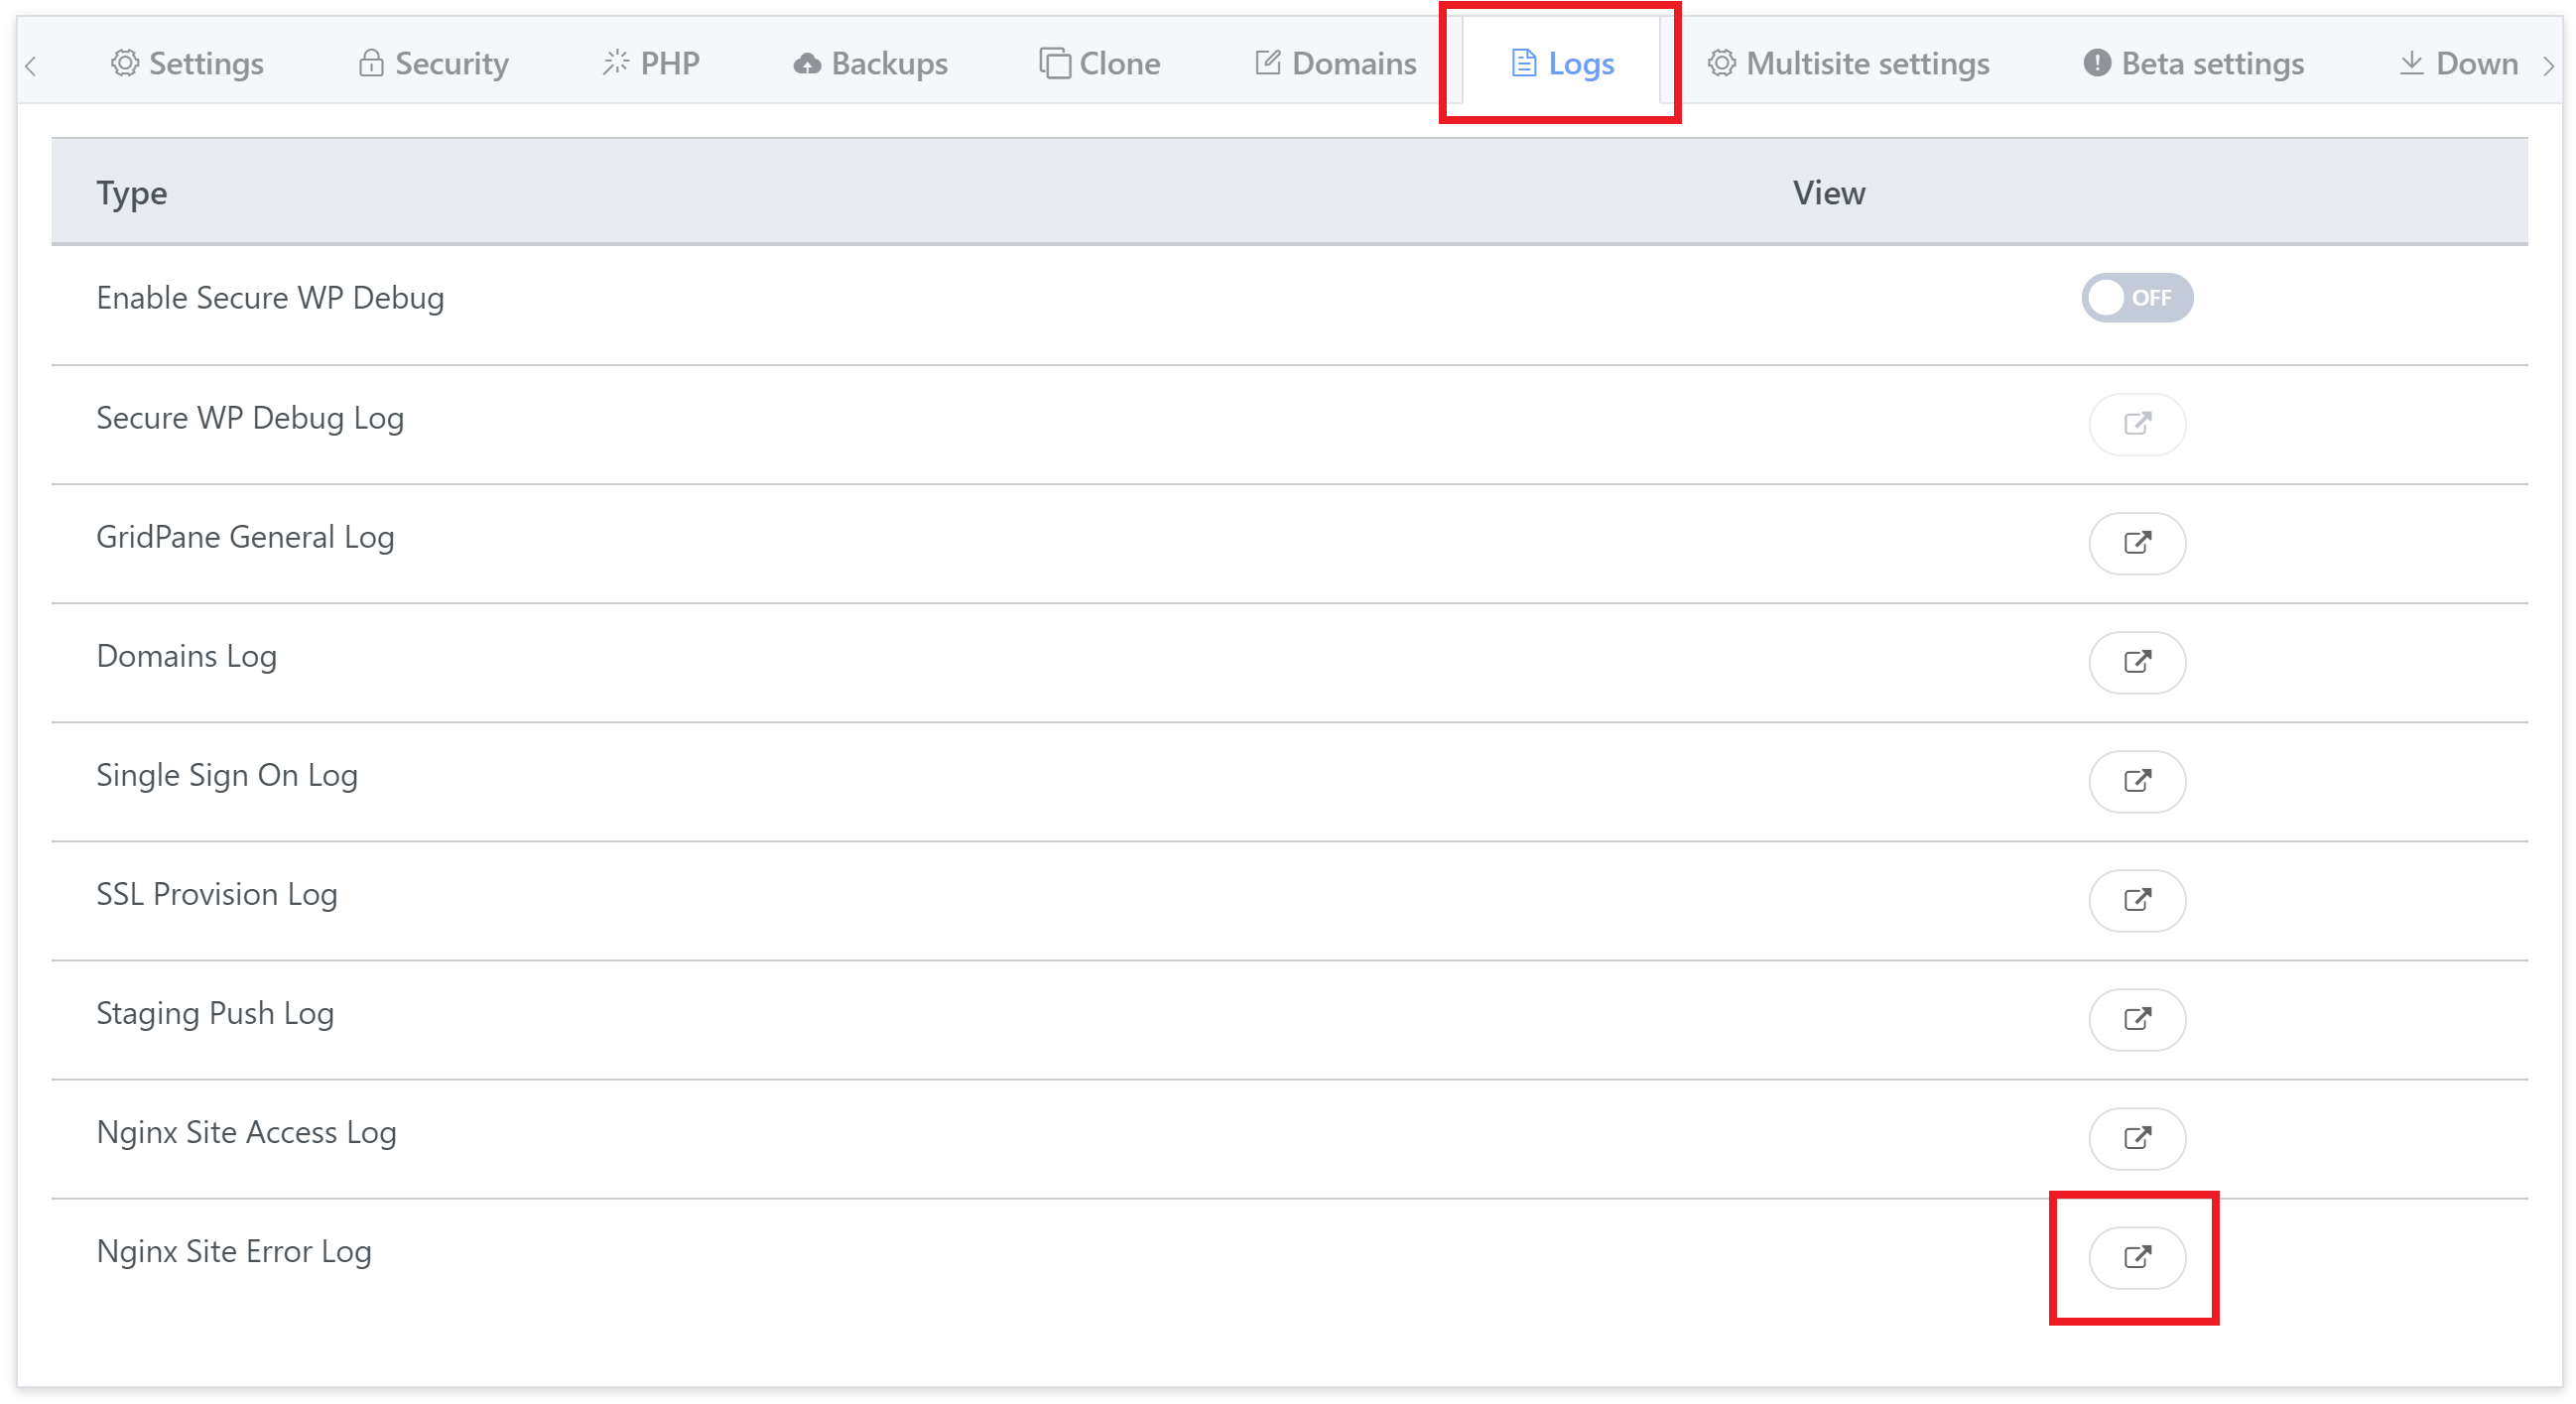
This will open up your sites customizer, and you will find a link to open your error log inside the Logs tab:

IaaS Server Graphs

You could also check your server graphs at your IaaS provider to see if you can spot irregularities such as sudden loads spikes and match them up with the timestamps in your Error log.

Step 4. Enable PHP Slow Logging

Enable the PHP-FPM slowlog, set it to 20-30 seconds, and see if any PHP script is running long.

In the case where Blogvault was the root cause, slow logging and found this to be taking place:

[04-Jan-2021 15:14:38] [pool redacted.com74] pid 19797
script_filename = /var/www/redacted.com/htdocs/wp-load.php
[0x00007fbda20149a0] mysqli_query() /var/www/redacted.com/htdocs/wp-includes/wp-db.php:2056
[0x00007fbda2014930] _do_query() /var/www/redacted.com/htdocs/wp-includes/wp-db.php:1945
[0x00007fbda2014850] query() /var/www/redacted.com/htdocs/wp-content/plugins/blogvault-real-time-backup/wp_db.php:30
[0x00007fbda20147d0] query() /var/www/redacted.com/htdocs/wp-content/plugins/blogvault-real-time-backup/wp_db.php:143
[0x00007fbda2014710] deleteBVTableContent() /var/www/redacted.com/htdocs/wp-content/plugins/blogvault-real-time-backup/callback/wings/watch.php:111
[0x00007fbda20145c0] process() /var/www/redacted.com/htdocs/wp-content/plugins/blogvault-real-time-backup/callback/handler.php:96
[0x00007fbda2014520] routeRequest() /var/www/redacted.com/htdocs/wp-content/plugins/blogvault-real-time-backup/callback/handler.php:34
[0x00007fbda20144a0] execute() /var/www/redacted.com/htdocs/wp-content/plugins/blogvault-real-time-backup/blogvault.php:119
[0x00007fbda2014300] [INCLUDE_OR_EVAL]() /var/www/redacted.com/htdocs/wp-settings.php:336
[0x00007fbda2014150] [INCLUDE_OR_EVAL]() /var/www/redacted.com/wp-config.php:133
[0x00007fbda20140c0] [INCLUDE_OR_EVAL]() /var/www/redacted.com/htdocs/wp-load.php:42

Disabling Blogvault fixed the issue here, but in your case it may not be a plugin that’s the cause, or you have a code issue that needs fixing, or a conflict resulting in an error.

Once you identify the cause you take the appropriate actions to resolve the issue.

1. Enabling PHP Slow Logging

The PHP Slow log is also located in the website configuration modal, inside the PHP tab:

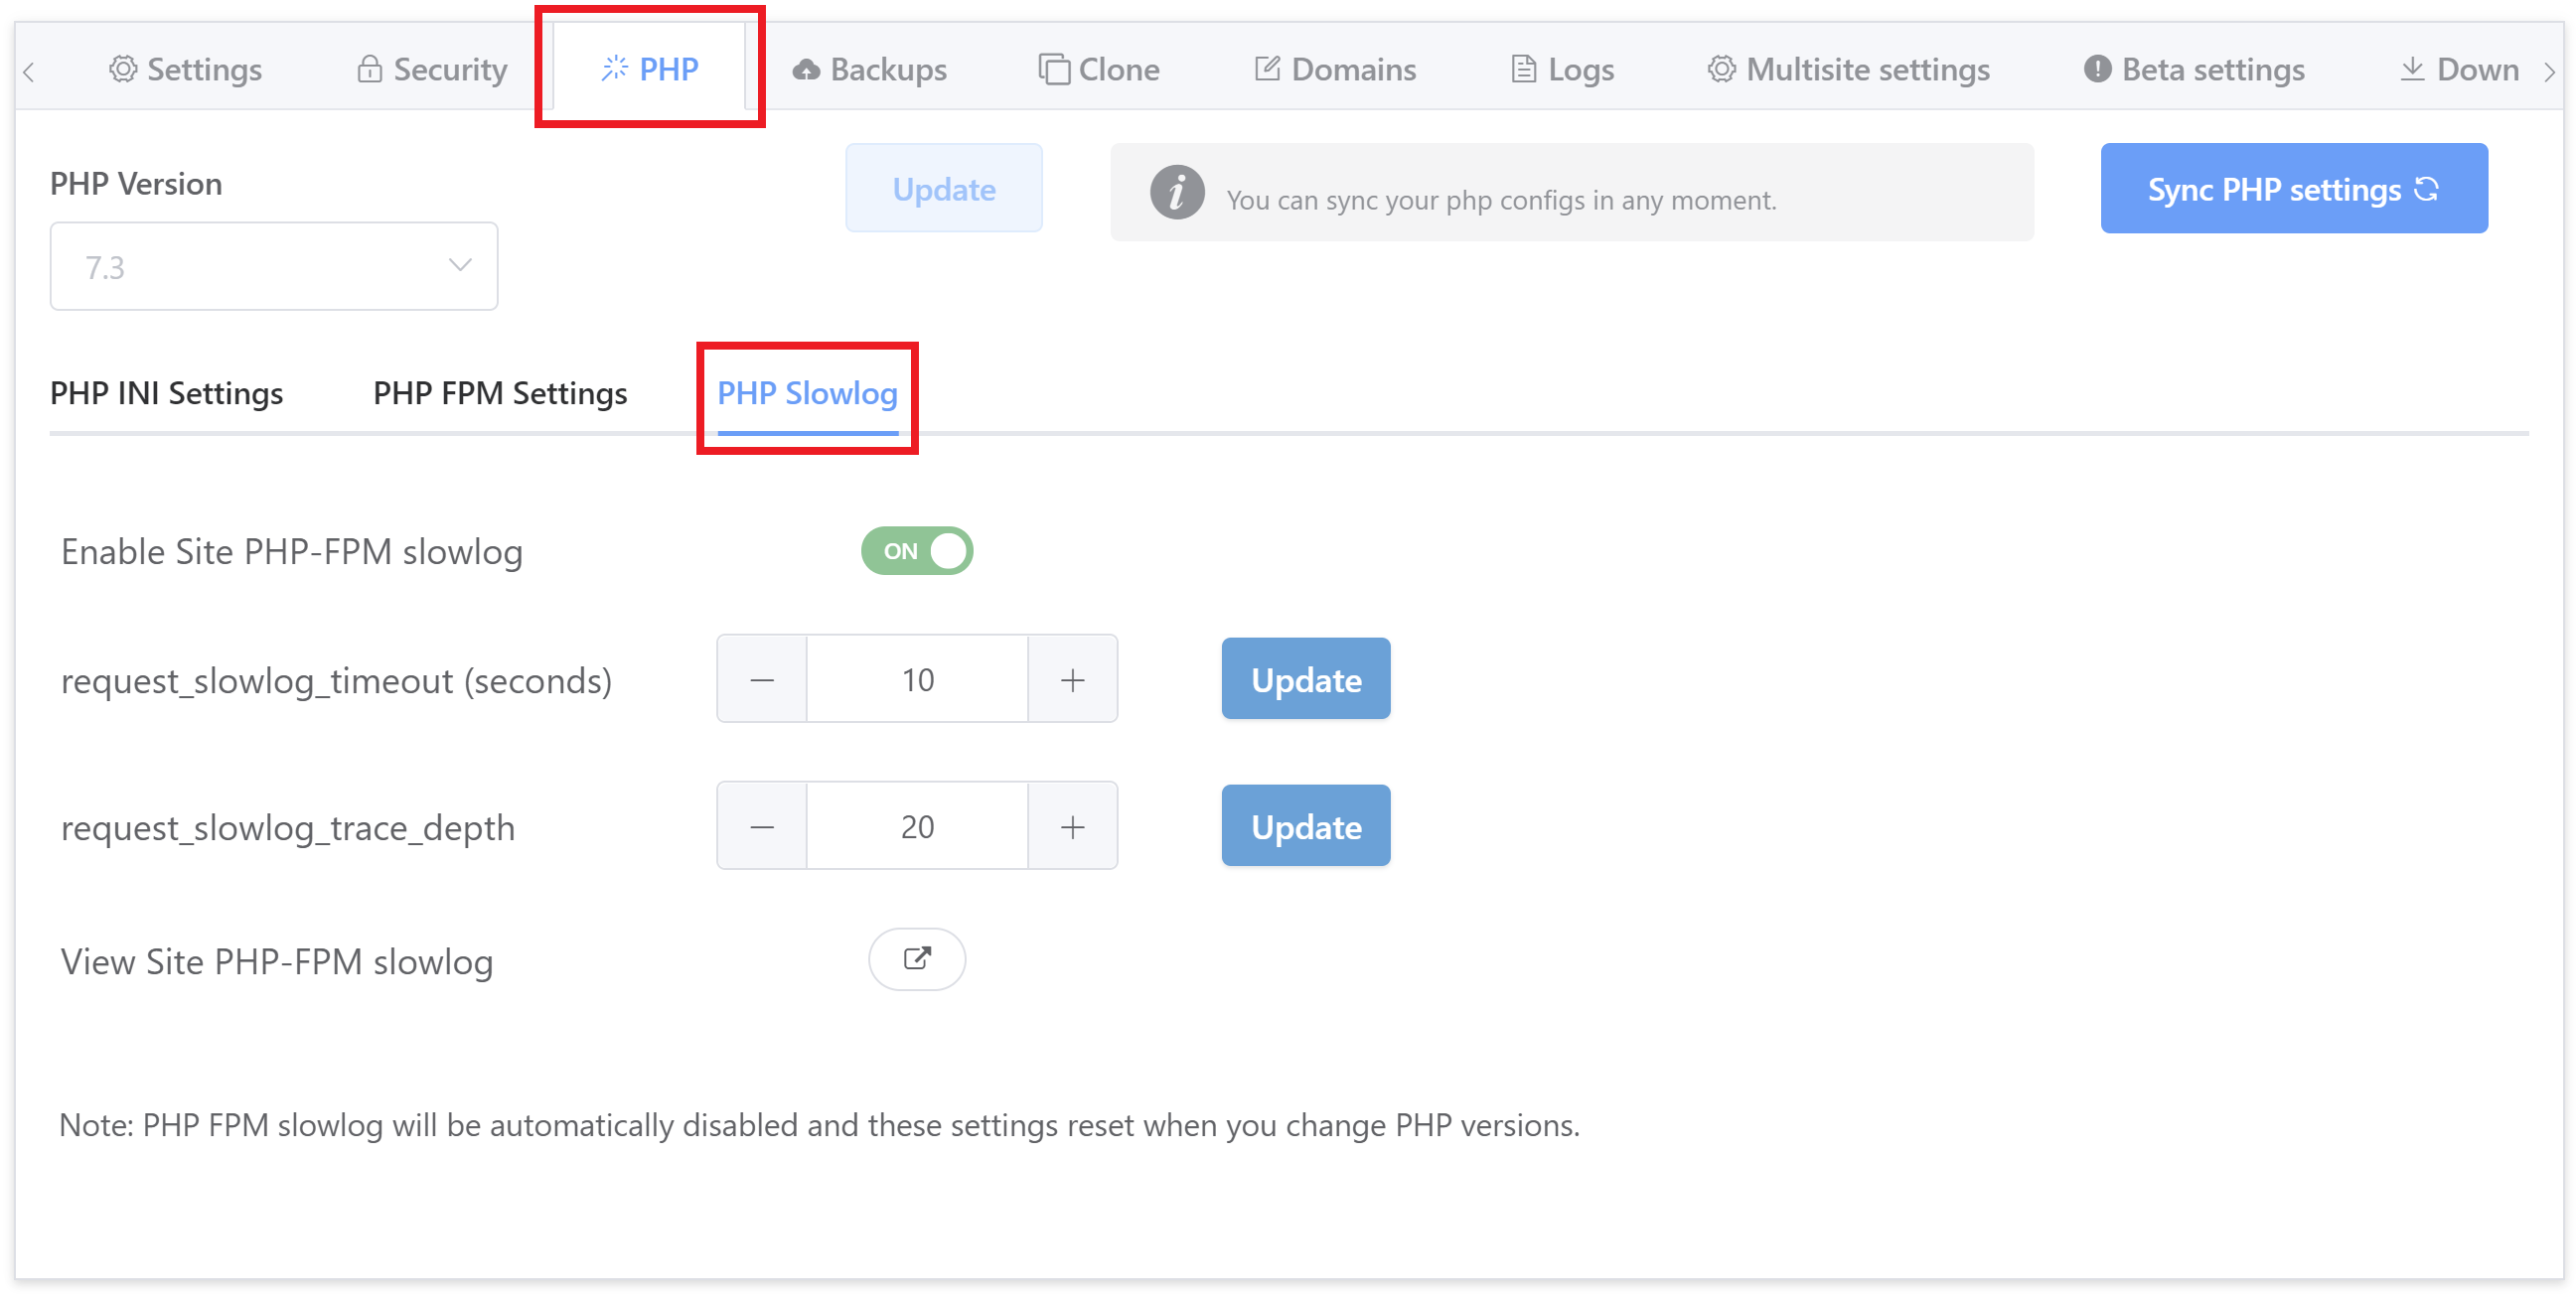
Toggle “Enable Site PHP-FPM Slowlog” to ON.

2. Configure the Logging Parameters

The “request_slowlog_timeout (seconds)” sets the minimum time a process has to run before it will be logged.

The “request_slowlog_trace_depth” sets how many functions proceeding the slow running process should be logged.

3. Visit your site and replicate the 502 Error

(If possible)

Now that logging is enabled, head back to your site and reload. If the 502 error is ongoing, you can then check your PHP slow log for the results.

Step 5. Check CPU Usage

If your server’s CPU usage is high, but neither PHP or MySQL is the cause, then you may be suffering from CPU steal from noisy neighbours, or simply have many people visiting your website at the same time.

If you’re experiencing 502 errors on more than one website, or performance issues across all your sites, this may be the cause.

For this you’ll need to SSH into your server. Please see the following articles to get started:.

Checking for CPU steal with TOP

The top command will let you know if other VPS’s on your server are stealing your CPU usage, or if your CPU is waiting on IO/drives. Run:

top

And you’ll see a table appear that looks as follows. We’re interested in the parts highlighted in red:
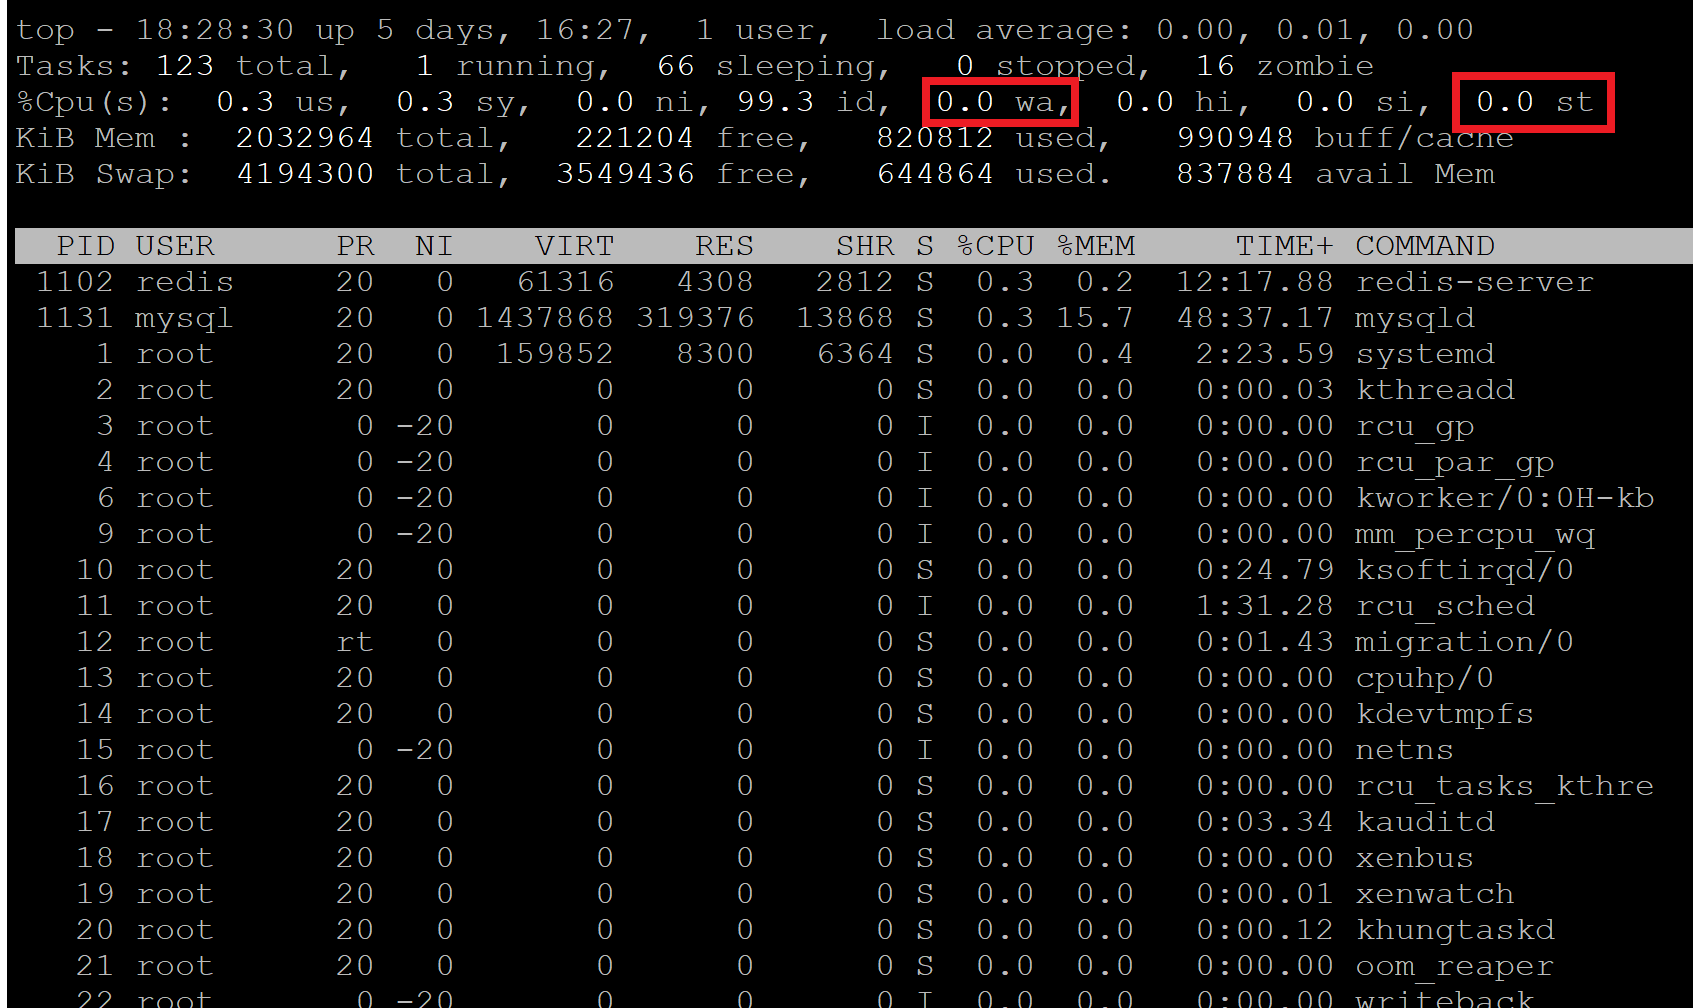
Steal “st”

Here you can see there’s no steal, but sometimes neighbours on your server can potentially steal a lot of your CPU – sometimes over 50% or more.

If you’re experiencing server steal then you need to contact you IaaS provider directly to let them know what’s going on so they can take action accordingly.

I/O Wait “wa”

If this is high then the cpu is waiting on the IO/drives. You can exit top and install run iotop to see which process is causing the most I/O utilization on your server.

To exit top hit Ctrl+C.

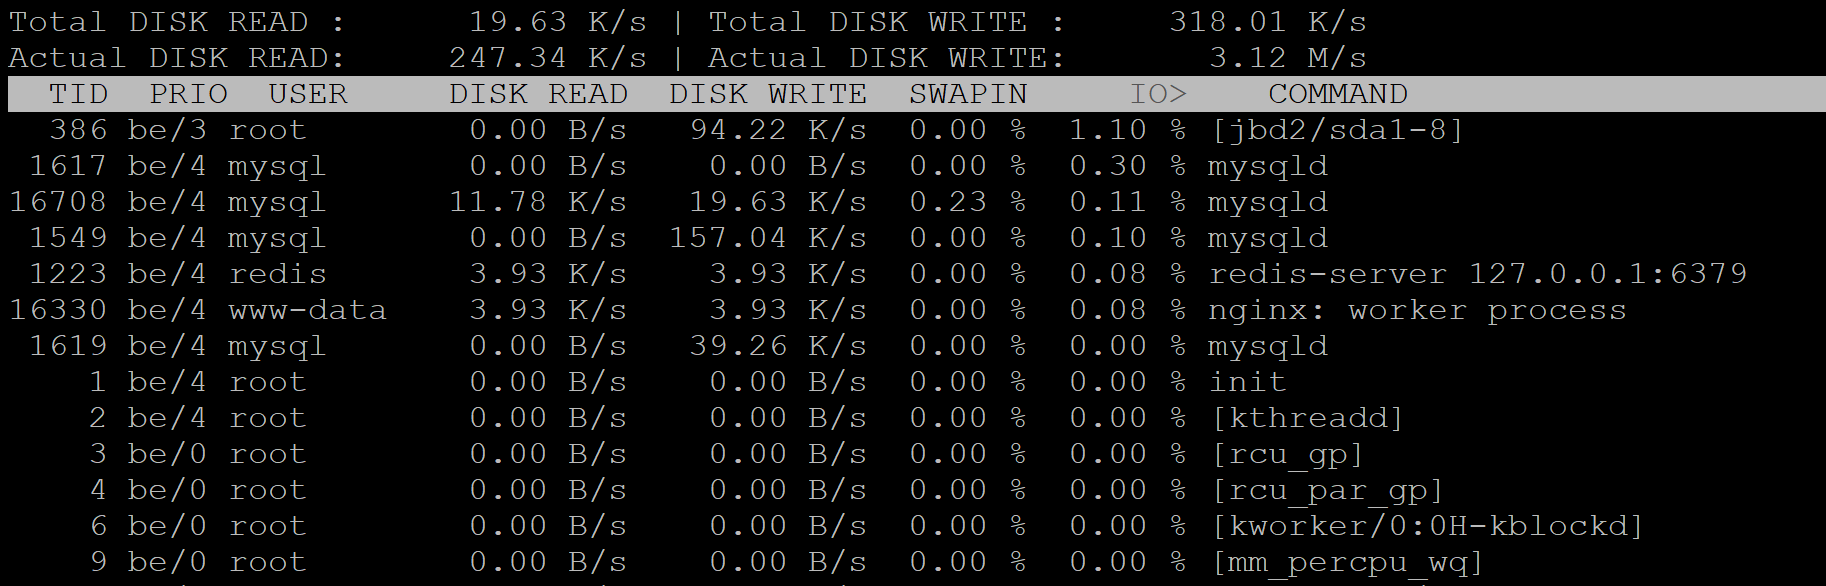
You can install iotop with:

apt install iotop

Then run:

iotop

iotop will list all of the processes running with the heaviest process at the very top.

If your steal and wait time are clear, then proceed below. To exit top/iotop hit Ctrl+C.

Checking active processes with HTOP

The information presented by htop will identify the processes responsible for high resource usage on the server. By default, processes are sorted by CPU usage – the highest at user at the very top of the table. To get started run:

htop

This will open up a table that looks like the following:

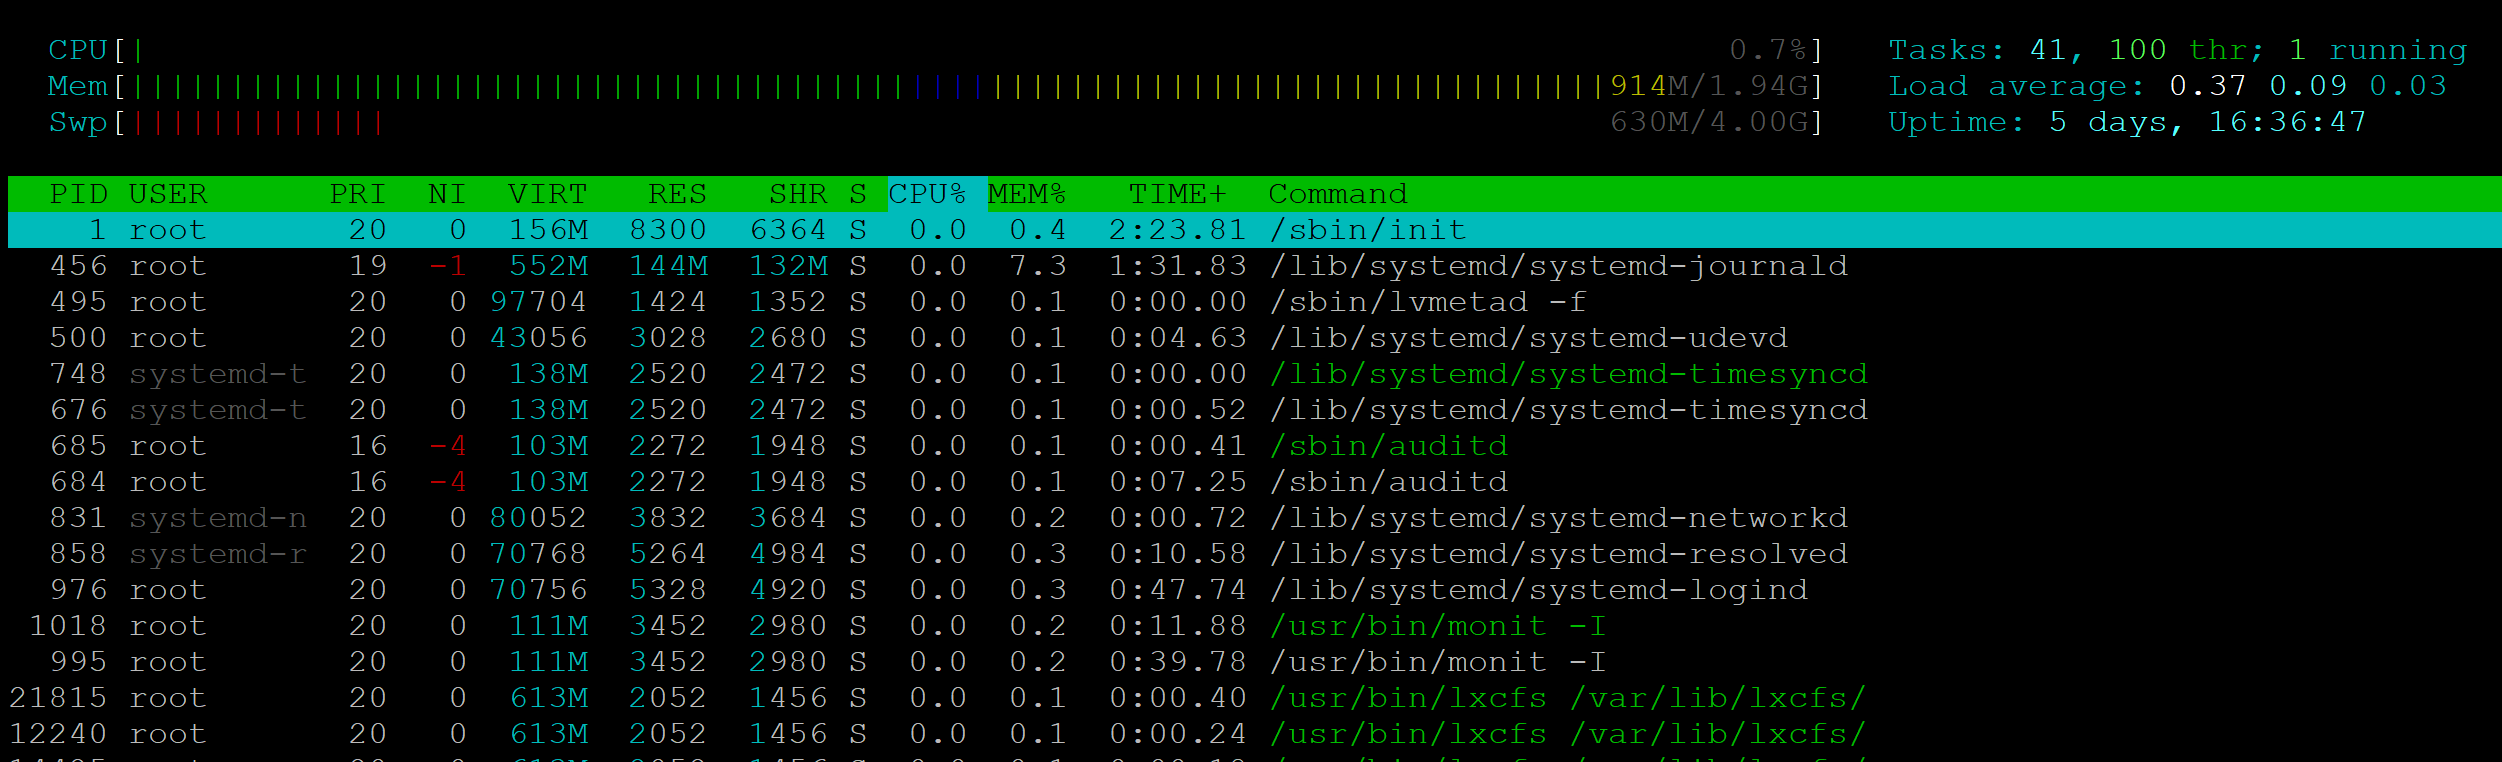
Here you’ll be able to see what’s going on and which of your websites are responsible for any high usage. 

If you identify your site, you now dig deeper into what’s going on at the website level. It may also be that a different site than you were expecting is the root of the cause. To exit htop hit Ctrl+C.

You can learn more about using top and htop in these articles:

How to use the top command to monitor system processes and resource usage

How to use the htop command to monitor system processes and resource usage

6. Your websites database tables are locked

The Problem
Plugins are locking up your database. The most common plugins we see for this are Blogvault, Malcare, and Rankmath.

Diagnosis
To check if you have locked database tables, SSH into your server and run the following command:

gp mysql login root

Now logged into MySQL, check your active processes with:

show processlist;

If you see “Waiting for table metadata lock,” you’re experiencing table locking. Here’s an example of what this looks like:

				
					mysql> show processlist;
+-------+---------------------+-----------+---------------------+---------+--------+---------------------------------+------------------------------------------------------------------------------------------------------+-----------+---------------+
| Id    | User                | Host      | db                  | Command | Time   | State                           | Info                                                                                                 | Rows_sent | Rows_examined |
+-------+---------------------+-----------+---------------------+---------+--------+---------------------------------+------------------------------------------------------------------------------------------------------+-----------+---------------+
|     5 | event_scheduler     | localhost | NULL                | Daemon  | 558150 | Waiting on empty queue          | NULL                                                                                                 |         0 |             0 |
| 34478 | VOO_example_com | localhost | VOO_example_com | Sleep   |  70388 |                                 | NULL                                                                                                 |         0 |             0 |
| 34479 | VOO_example_com | localhost | NULL                | Sleep   |  70388 |                                 | NULL                                                                                                 |      6230 |          6230 |
| 34480 | VOO_example_com | localhost | NULL                | Sleep   |  70387 |                                 | NULL                                                                                                 |    748034 |        748034 |
| 40581 | VOO_example_com | localhost | VOO_example_com | Query   |  14241 | Waiting for table metadata lock | DROP TABLE IF EXISTS wp_bv_ip_store                                                                  |         0 |             0 |
| 40582 | VOO_example_com | localhost | VOO_example_com | Query   |  14140 | Waiting for table metadata lock | DROP TABLE IF EXISTS wp_bv_ip_store                                                                  |         0 |             0 |
| 40583 | VOO_example_com | localhost | VOO_example_com | Query   |  14040 | Waiting for table metadata lock | DROP TABLE IF EXISTS wp_bv_ip_store                                                                  |         0 |             0 |
| 40984 | VOO_example_com | localhost | VOO_example_com | Query   |  12582 | Waiting for table metadata lock | SELECT * FROM wp_bv_ip_store WHERE '�<:' >= `start_ip_range` && '�<:' <= `end_ip_range` && `is_lp`   |         0 |             0 |
| 40985 | VOO_example_com | localhost | VOO_example_com | Query   |  12518 | Waiting for table metadata lock | SELECT * FROM wp_bv_ip_store WHERE '�<:' >= `start_ip_range` && '�<:' <= `end_ip_range` && `is_lp`   |         0 |             0 |


This particular example was MalCare, which shares the same table prefix with Blogvault – another plugin we’ve seen at the cause. Other plugins we’ve seen include Cleantalk, Rank Math, and WPvivid.

Exit MySQL with:

exit

How to Fix it

You can restart MySQL with the following command:

gp mysql restart

You can also restart MySQL inside of Monit as well.

This is something we frequently see with WaaS networks. You’ll want to ensure that your using InnoDB and not MyISAM, and then determine whether this is related to our backup system.

If you’re experiencing these issues around the start of every hour, this is likely related to your backup system, Borg, running and locking your tables while it takes the backups. If you have a large website that takes a long time to backup, this could frequently impact your performance for extended periods of time.

You can also learn how to change your backup schedule here:

GridPane Local and Remote Backups

Next Steps

Unfortunately, 502s are difficult to diagnose without seeing what’s going on in real-time, but the above you should help you get started.

MySQL slow logging and PHP slow logging will help you spot long-running requests.

We also have these guides on troubleshooting performance issues as well:

Diagnosing Performance and 504 Timeout Issues

WordPress Debug and Query Monitor

GridPane Logs – How to Find Them and When to Use Them