Introduction
WordPress Debug and the excellent Query Monitor plugin are a highly effective combination to help you diagnose performance issues on your individual WordPress websites. In this article, we’ll take a quick look at both tools and provide instructions on how to get started using them on your GridPane hosted websites.
Table of Contents
An Intro to WP_DEBUG
If you’re having issues with your site, WordPress debug mode can help you find out what’s going wrong by recording any and all PHP errors that occur across your website. These errors will be displayed directly inside your dashboard, as well as also logging them in the WP Debug Log.
This information will help you identify the specific functions that are throwing errors and tie them back to the source of the problem.
We recommend using Debug on your staging websites, but if you are using it on a production website, be sure to turn it off again as soon as you’re finished troubleshooting, as it can reveal parts of your PHP to website visitors.
An Intro to Query Monitor
Query Monitor has a ton of features. Here we’ll be focusing on identifying PHP and database issues that are harming your website’s performance, and with Query Monitor, you can view every transaction that takes place as the webpage is loaded, and you can do this on any page on your website – both front end and admin side.
Once installed, each page you load will generate a report, and each query is recorded along with the time it takes to run and the function that generated it. Armed with this information, you’ll be able to pinpoint exactly where things are going wrong and take action accordingly.
It’s beyond the scope of this article to analyze everything this plugin can do in detail, but you can learn more about everything it has to offer over on the plugin’s website here: https://querymonitor.com/ and the plugin page here: https://wordpress.org/plugins/query-monitor/
Step 1. Activate WP_DEBUG and Query Monitor
You can activate WP_DEBUG and Query Monitor directly within your GridPane dashboard or on your server with GP-CLI.
Option 1. Activate Within Your Account
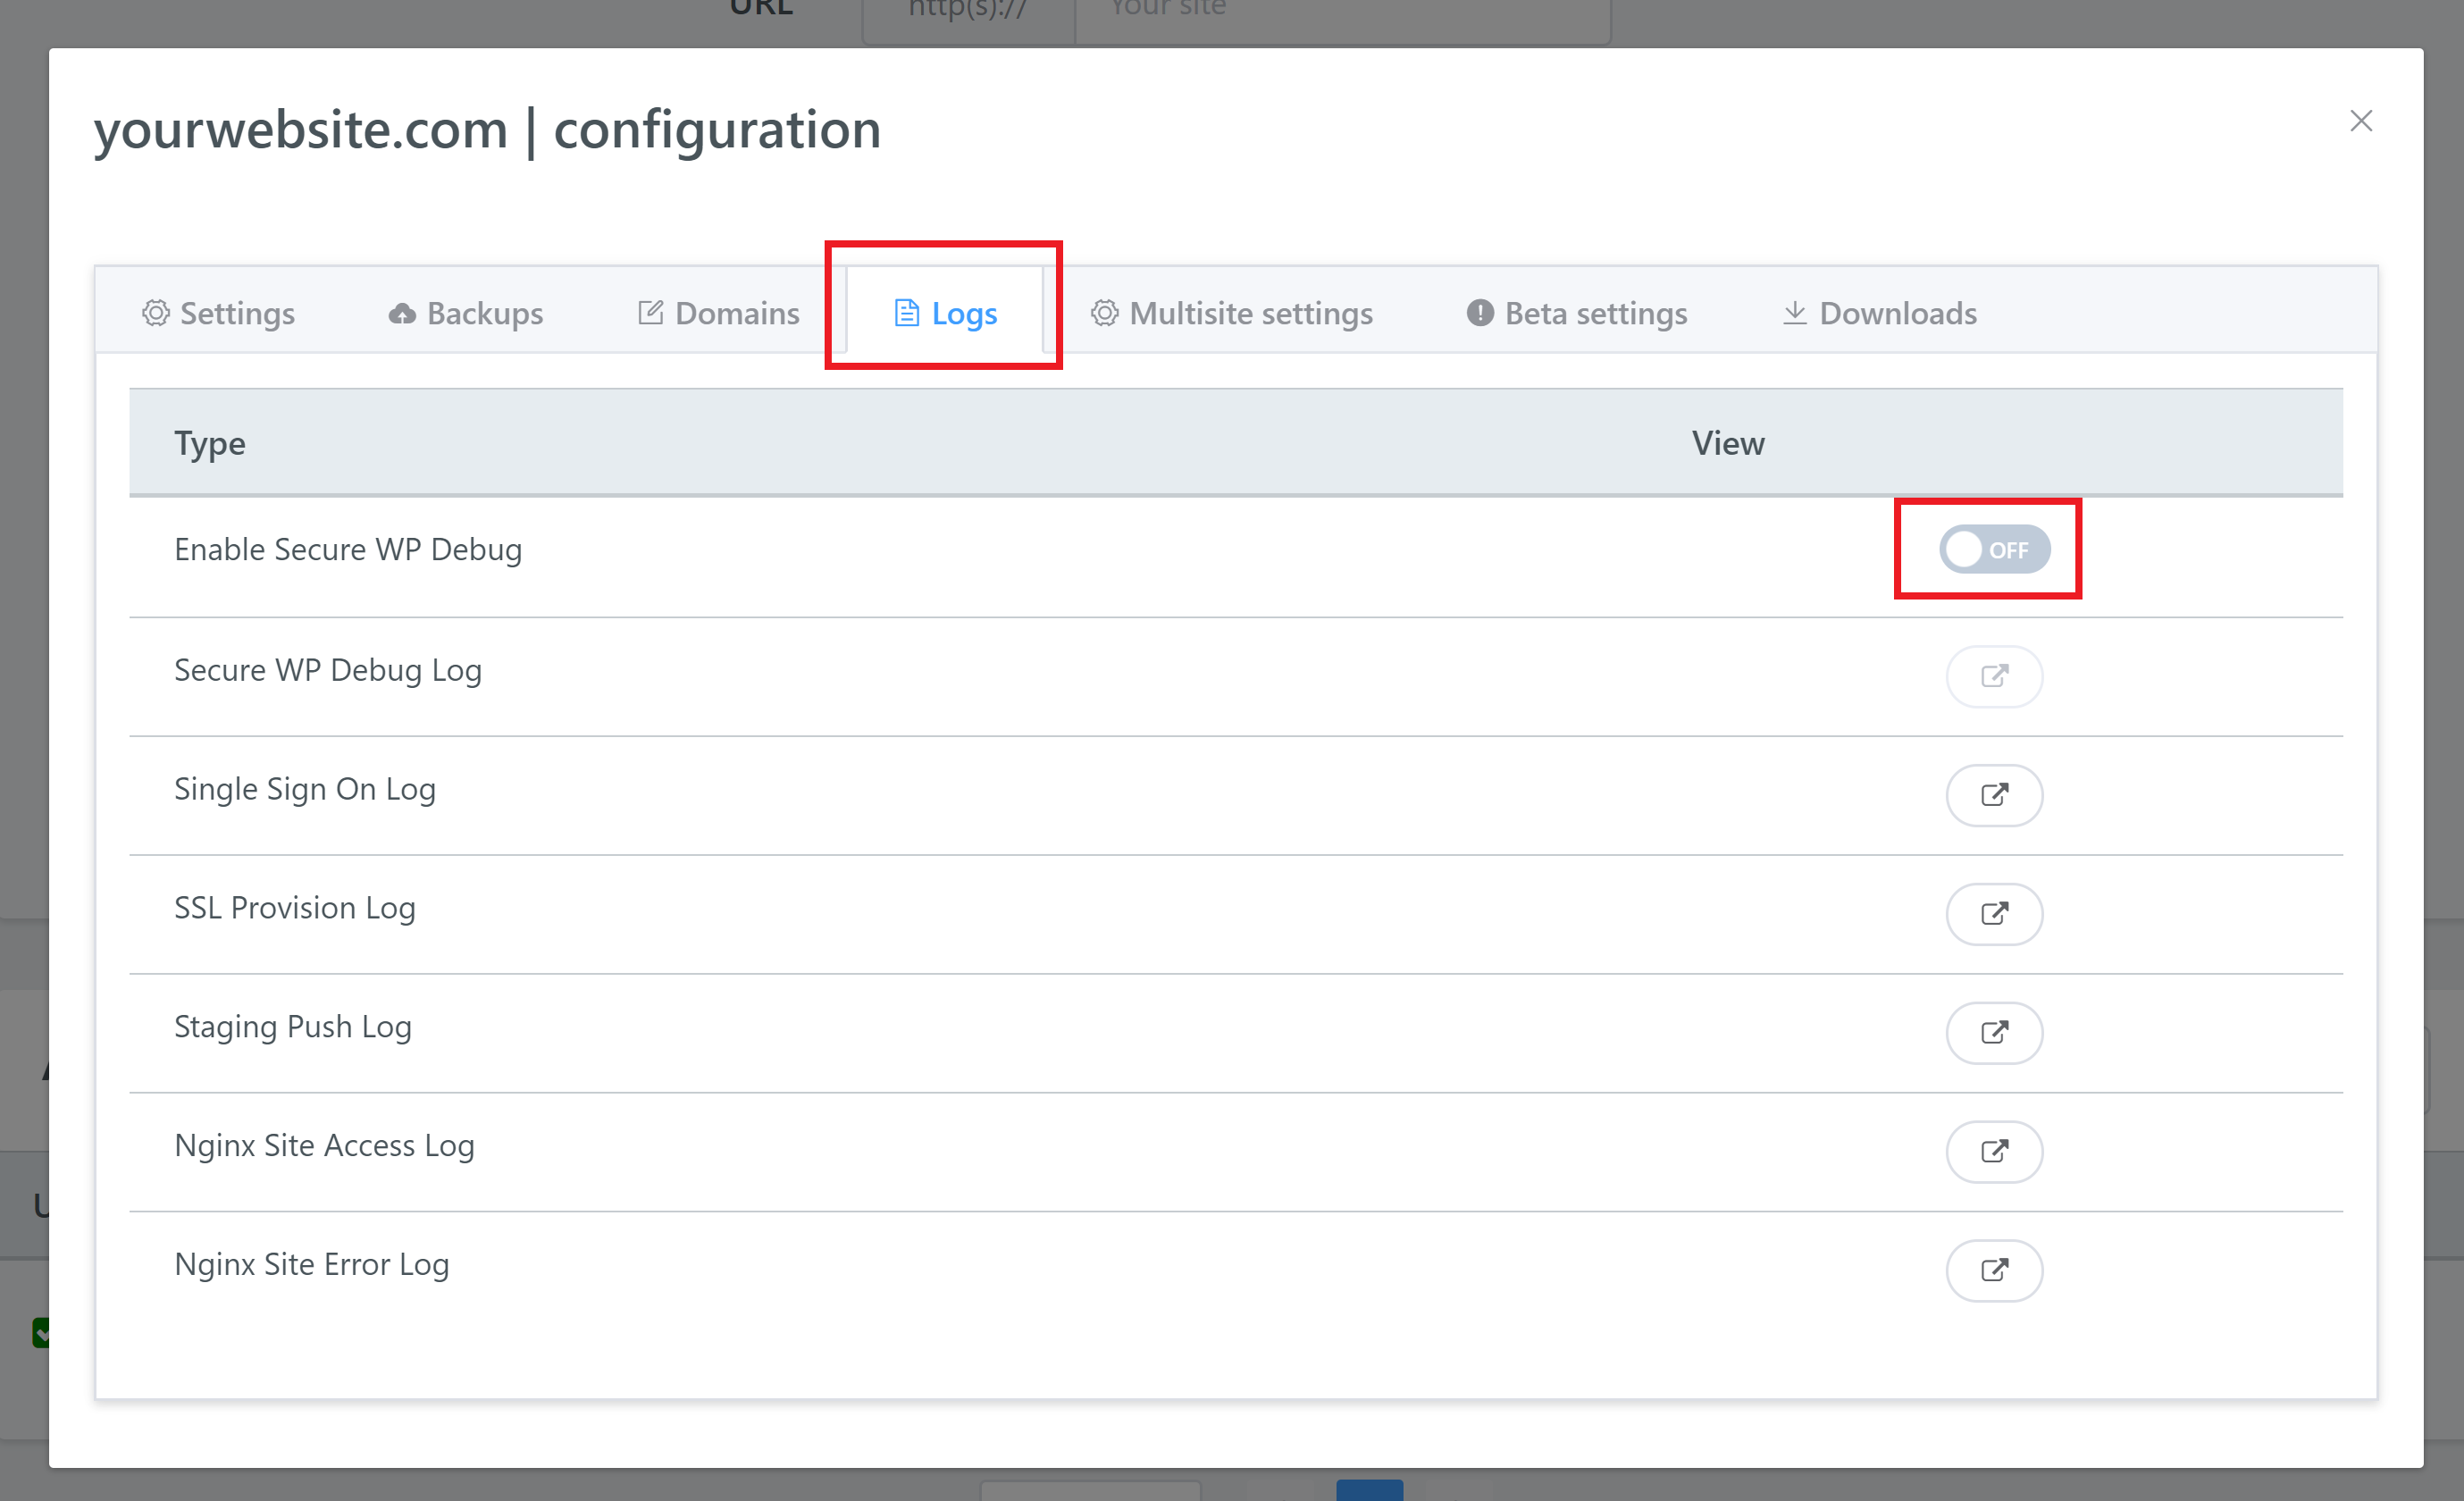
GridPane has a very handy toggle built right into your website’s configuration modal that will both turn on debug and debug logging and also install and activate the query monitor plugin.
In your GridPane account, head to your Sites page and click on the domain you’re experiencing trouble with to open up the configuration modal. Click through to the Logs tab, and toggle on “Enable Secure WP Debug“.
Option 2. Activate via GP-CLI
To get started, you’ll first need to connect to your server via SSH. If this is the first time connecting to one of your servers, please see the following guides to get started:
Step 1. Generate your SSH Key
Step 2. Add your SSH Key to GridPane (also see Add default SSH Keys)
Step 3. Connect to your server by SSH as Root user (we like and use Termius)
Once connected, you can activate WP_DEBUG with the following command (replacing site.url with your websites URL):
gp site site.url -wp-debug-on
Once you’ve completed your debug, you can deactivate it with:
gp site site.url -wp-debug-off
Step 2. Login and Begin your Diagnosis
First, log in to your site. WP_DEBUG will display any PHP errors or warnings at the top of each page in your dashboard.
If you have a specific page you’ve been having trouble with, head there first. If it’s a general performance issue across the whole website, head to your homepage.
In the admin bar at the top of your site, you’ll see some stats provided by Query Monitor.
These metrics mean the following:
- Page load time
- Peak memory usage
- Database query time
- Number of database queries
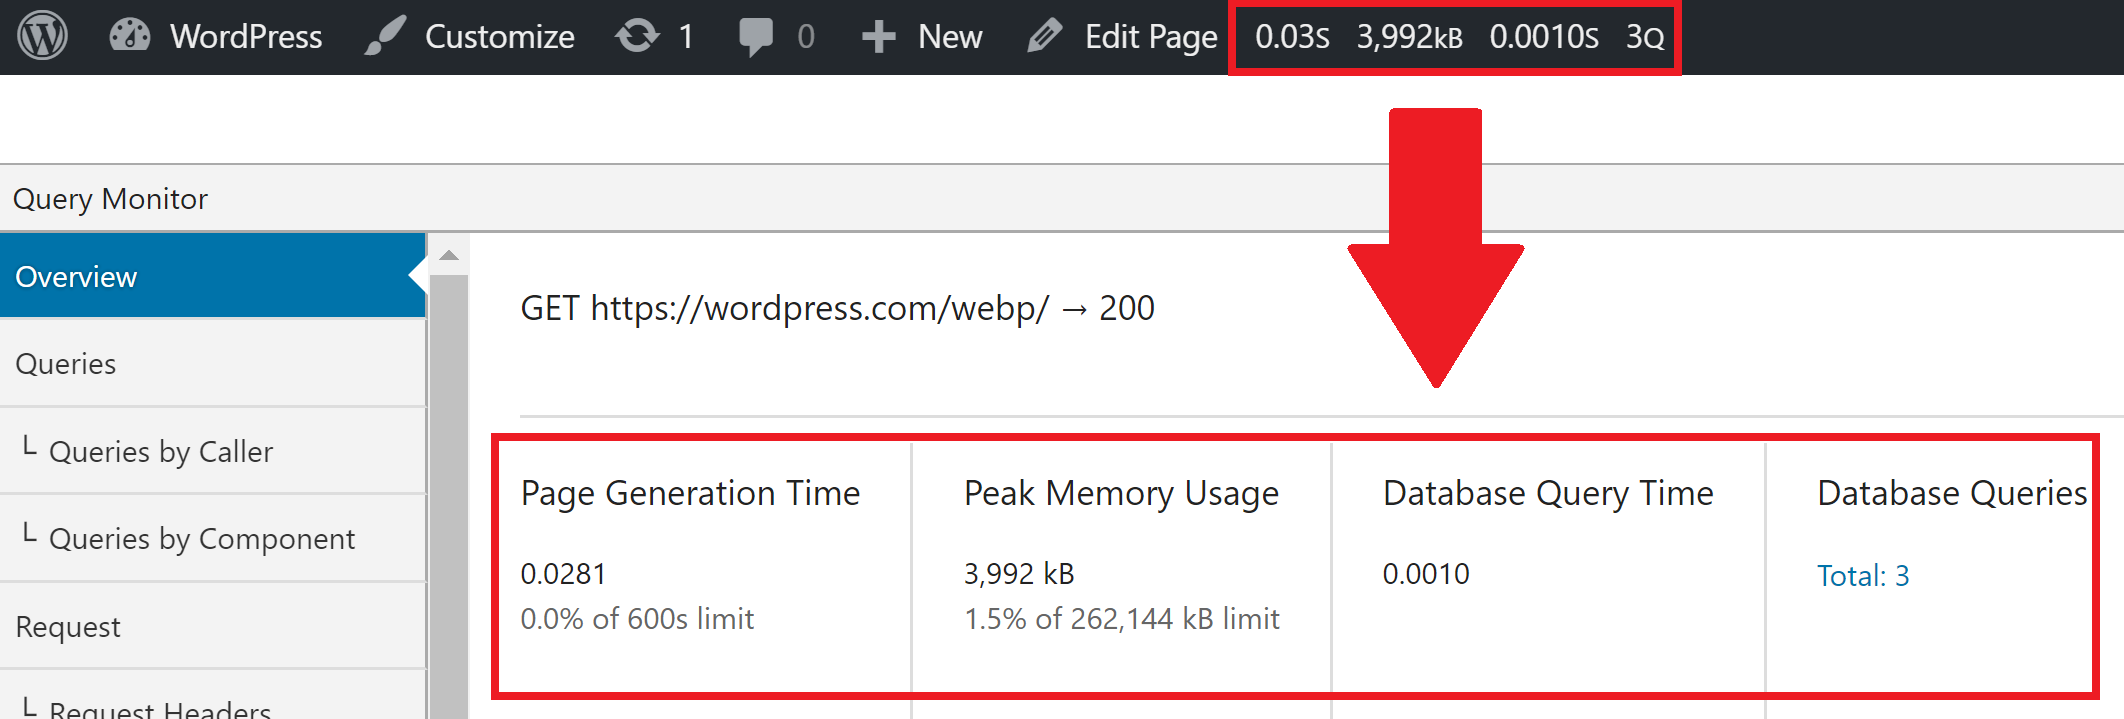
This is a great feature that can show you at a glance whether the page you’re on has a performance issue that needs to be addressed.
Hover over the admin bar to see an overview of what you can dive into.
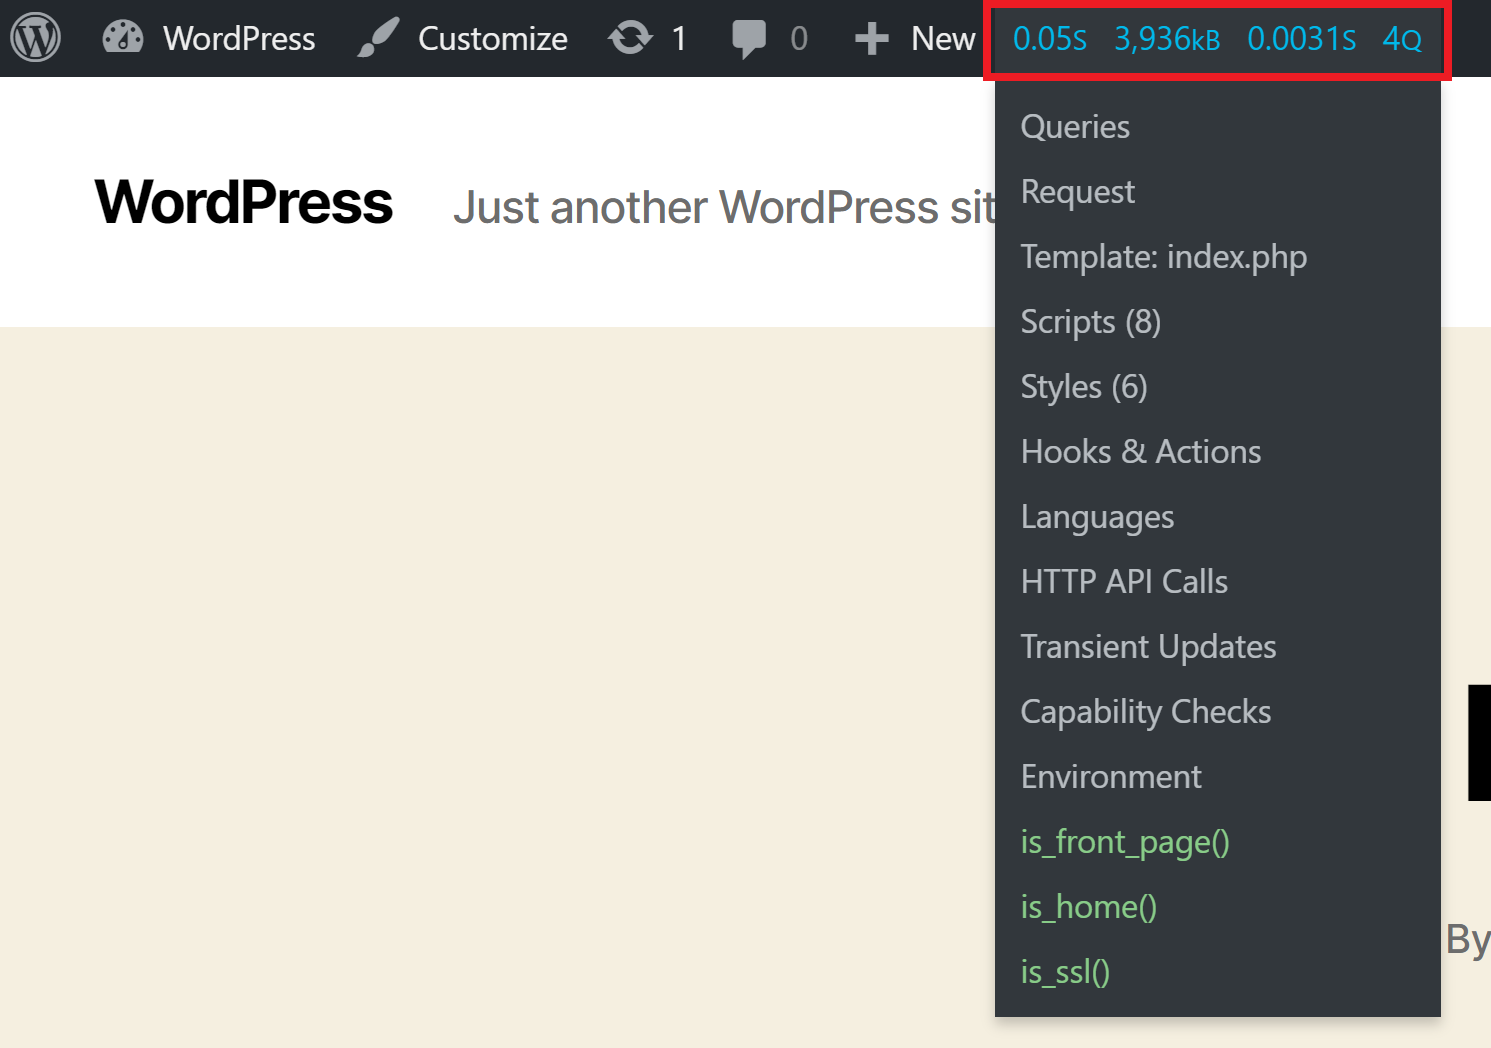
If you have any Notices or Warnings highlighted at the top, this is the info we’re looking for. If there are no warnings, continue to step 3 below.
Click through to the warnings/notices to view the offending queries and the responsible component (usually a plugin). With the information you gather here, you can now begin testing. If you deactivate the plugins / change the theme causing the problems, does your website speed go back to normal?
If yes, then you’ve now identified the cause of your slow website and can begin to make plans to fix the issue either by contacting the plugin/theme developer or replacing it with something more performant.
Step 3. Diving Into to Your Queries
Queries are the most interesting of the available options in terms of the data it provides us.
You can sort queries by caller (includes plugins), the number of affected rows, and time. Sorting by time allows you to focus on the heaviest queries first and see the root cause responsible for them.
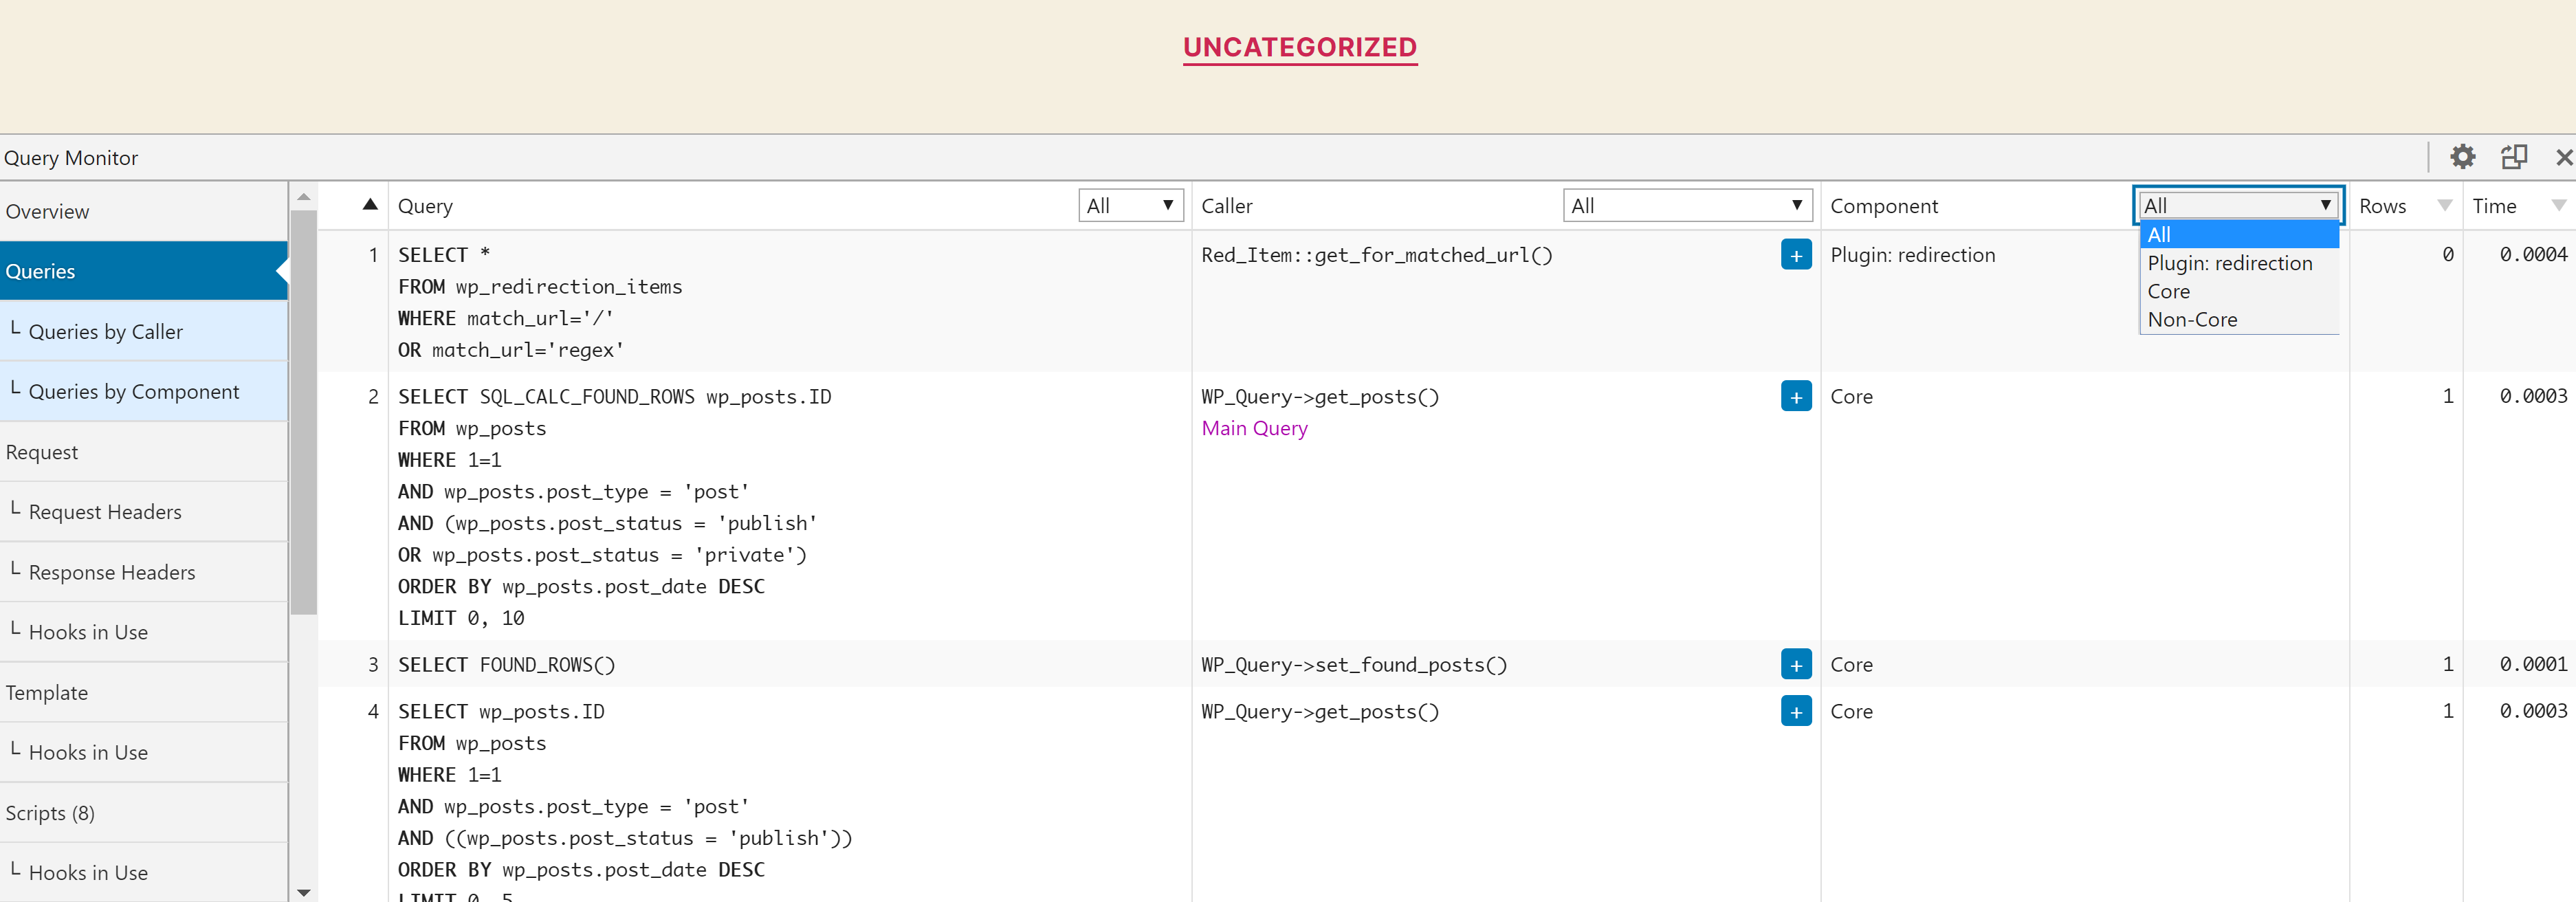
It’s important to note that some functionality is query heavy – for example, Woocommerce store pages.
Or it may be a poorly coded theme along with inefficient plugins, all bringing down your site’s performance together.
Here we’re looking to identify what’s causing the website to work so hard. If it is database-heavy processes that are integral to your website, then you may need to look at object caching or specific solutions that can address your problems.
If it’s not obvious what’s slowing down your site, then you may need to begin deactivating plugins one by one until you can identify the cause. Or better yet, deactivate all plugins and switch to a default theme to get a performance baseline, and then begin reactivating them one by one.
A staging environment is perfect for this kind of testing.
Step 4. Reviewing the WP Debug Log
Inside your GridPane account, open up your website configuration modal and navigate to the logs tab like you did in step 1.
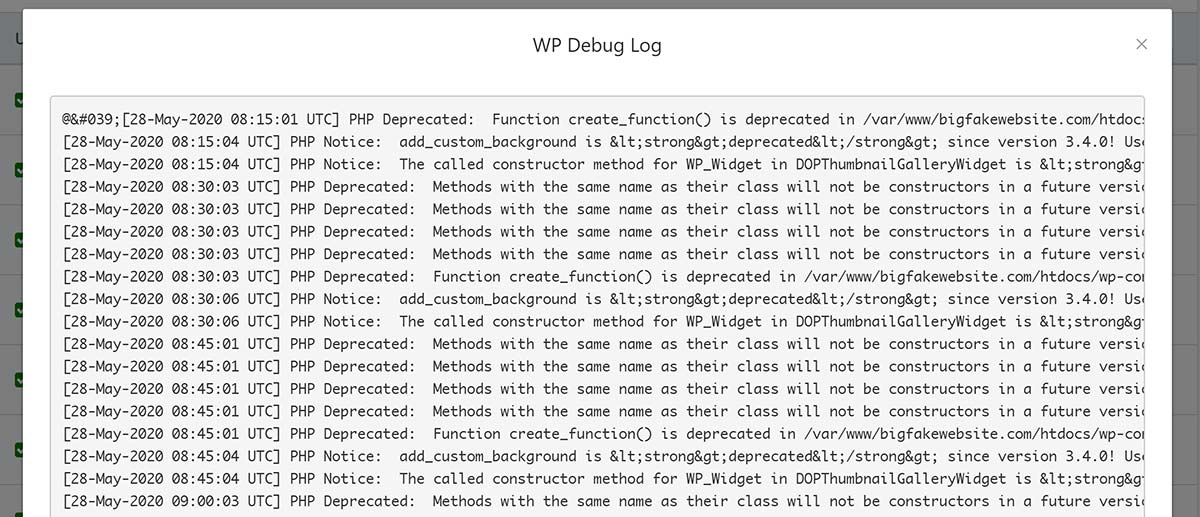
Here you can review any information gathered as you’ve been navigating around your website.
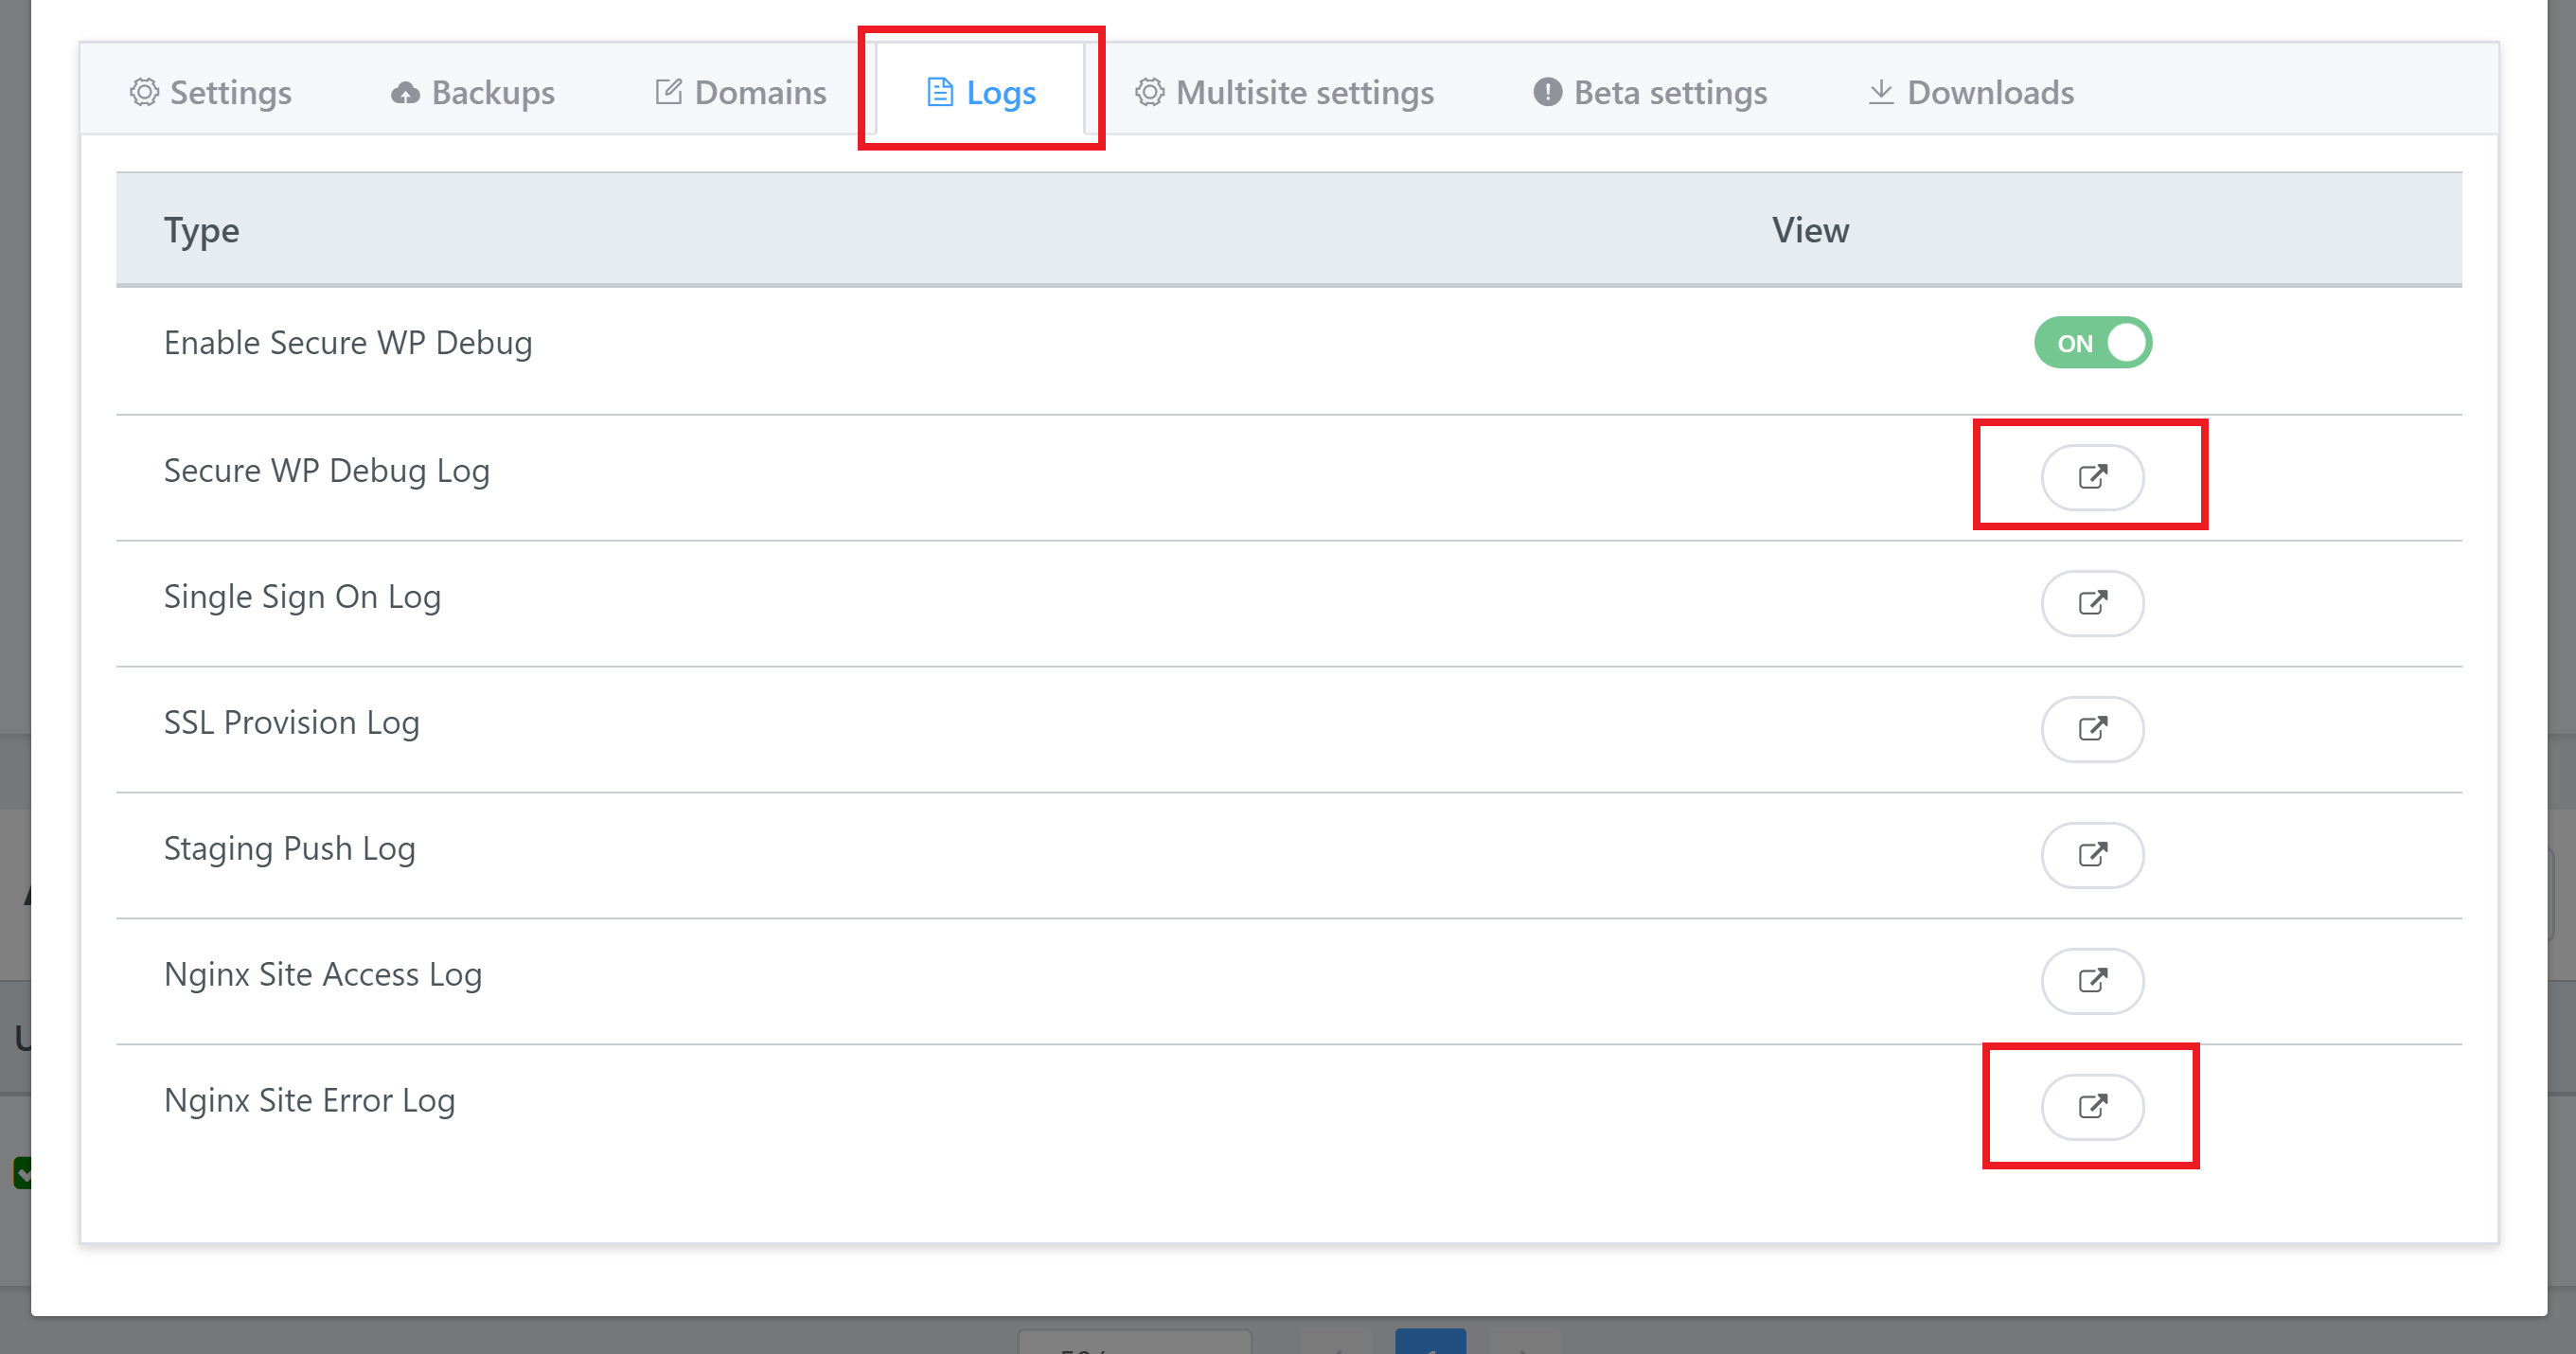
Information gathered here and inside the Nginx Error Log is often enough to see what’s going wrong on your website – and it’s usually plugin related.
Don’t forget to toggle debug off once you’re done!
