Using the GridPane Monit Stats and Service Manager

3 min read

Table of Contents

Introduction

The GridPane stack utilizes a custom configuration of the most reliable and effective open-source tools to ensure that your sites are delivered at blazing speeds and your server is both monitored 24/7 and proactively administered.

A crucial part of the stack is Monit, an open source tool that comes complete with all the features needed for system monitoring and error recovery. It is an incredibly lightweight Open Source utility for managing and monitoring Unix-like systems. Monit conducts automatic maintenance and repair and can execute meaningful causal actions in error situations.

At GridPane we have configured Monit’s secure and easily accessible interface so that you can monitor and manage your stack microservices with the click of a button.

This article will introduce the GridPane implementation of the Monit Service manager.

How to Open Monit

Monit is preinstalled on all of your servers, and as long as you have a server in your account, you’ll be able to head to your servers page and open Monit.

Step 1. Spin up a server

If you don’t already have a server, getting started is quick and simple. We have documentation on provisioning servers here:

Provisioning GridPane Servers

Once you have provisioned a server, you will see a Stats icon, if there are no sites on the server the icon will be greyed out and inactive. When you hover over the icon it will prompt you to create a site to activate the stats and service manager feature for the server.

Step 2. Open the GridPane SSO Monit Service Manager

Once a site has been deployed on the server, return to your Active Server list and you will see the Stat icon for the server has turned green and is active.

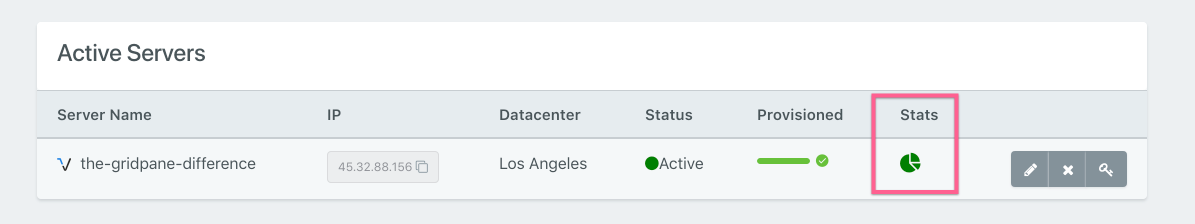
You can now click on the icon to open the SSO Monit Service Manager.

What Monit Monitors

The GridPane Monit configuration monitors each of the microservice processes in the stack, along with their CPU and memory usage:

  • Fail2Ban
  • Redis
  • PHP
  • MySQL
  • Nginx/OpenLiteSpeed

In addition, it monitors the System Load:

  • Overall CPU usage
  • Overall Memory usage
  • System Swap Memory
  • Overall Disk space usage

We actively monitor the size of your website directories:

  • /var/www: The size of your website directories.
  • /var/log/mysql: The active size MySQL, which includes  the collective size of all of your website databases.
  • /opt/gridpane/backups: The size of your local backups.

It monitors the SSL renewal status for each of your websites, unattended upgrades for the server, and automated backups.

And finally, it also has several settings to monitor important files, and checks that your Nginx or OpenLiteSpeed configurations are sound.

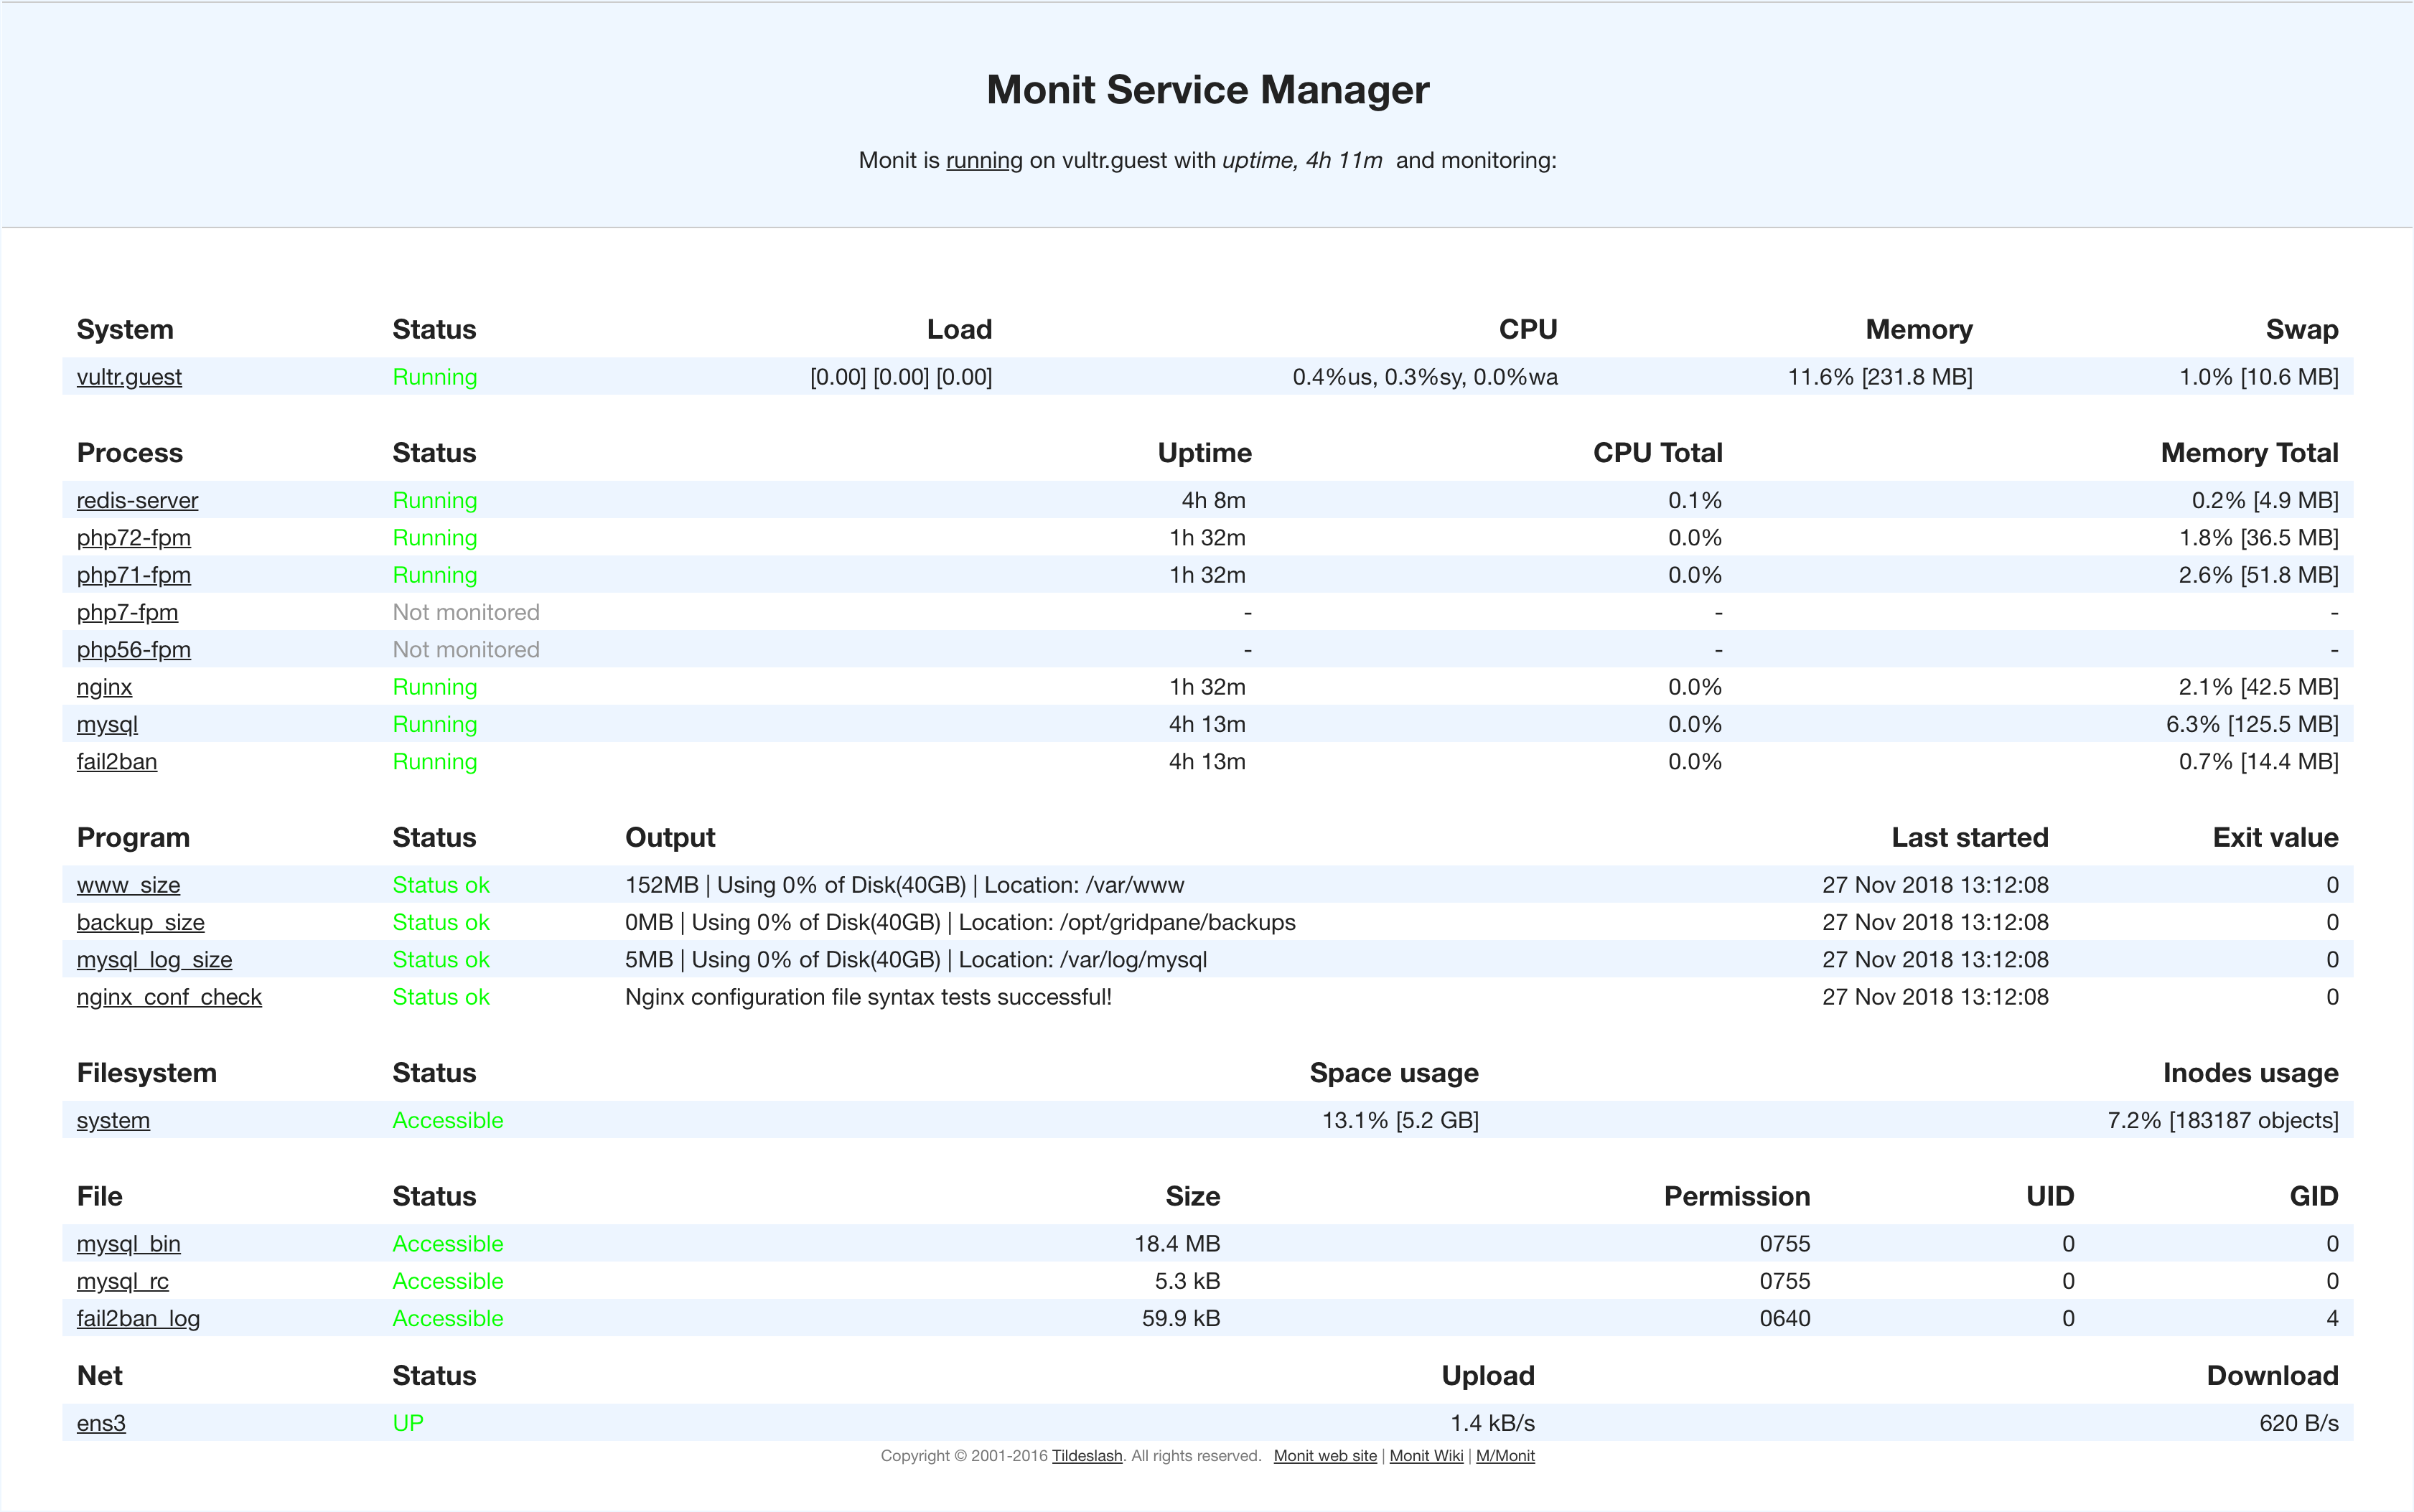
Using the Monit Service Manager to Enable/Disable services

With Monit we can also restart, enable, or disable services we are not using. To do this we would click on the name of the process we wish to manage.

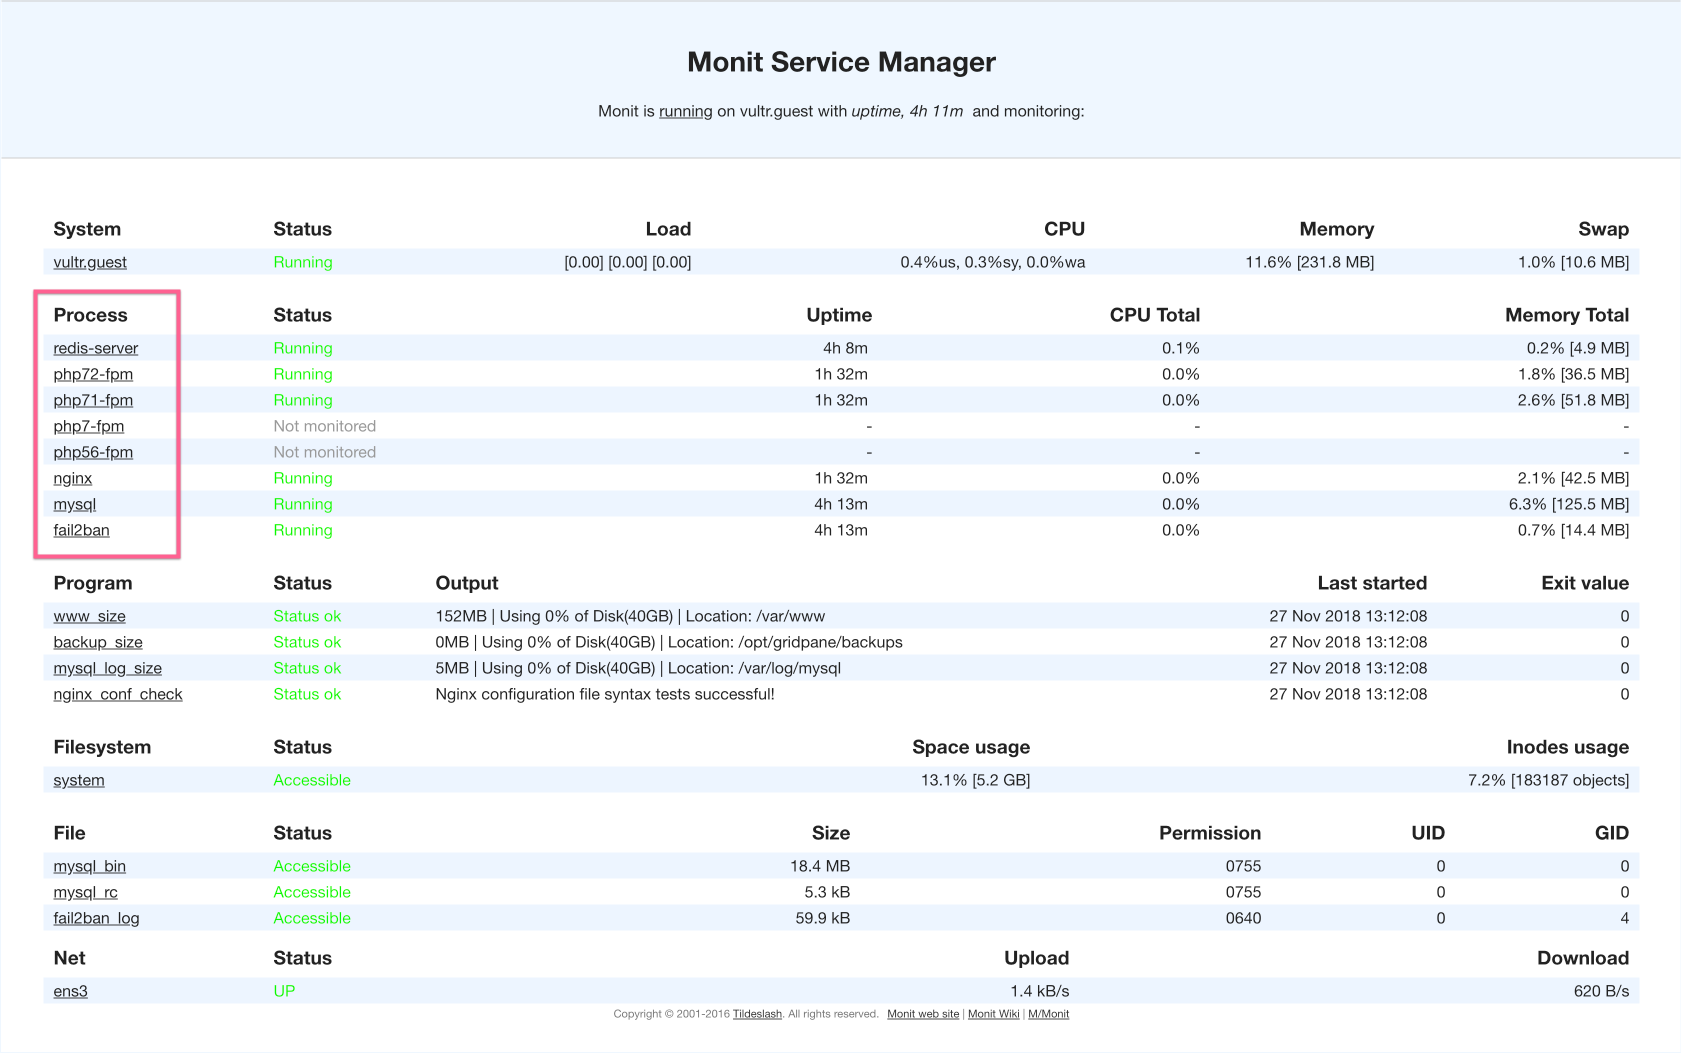
For example, you may just wish to restart Nginx without logging in to your server. You can easily do this by clicking the restart service at the bottom of the Nginx Monitoring page.

Or if you only use PHP7.2, then you can disable the other version of PHP and free some memory up.

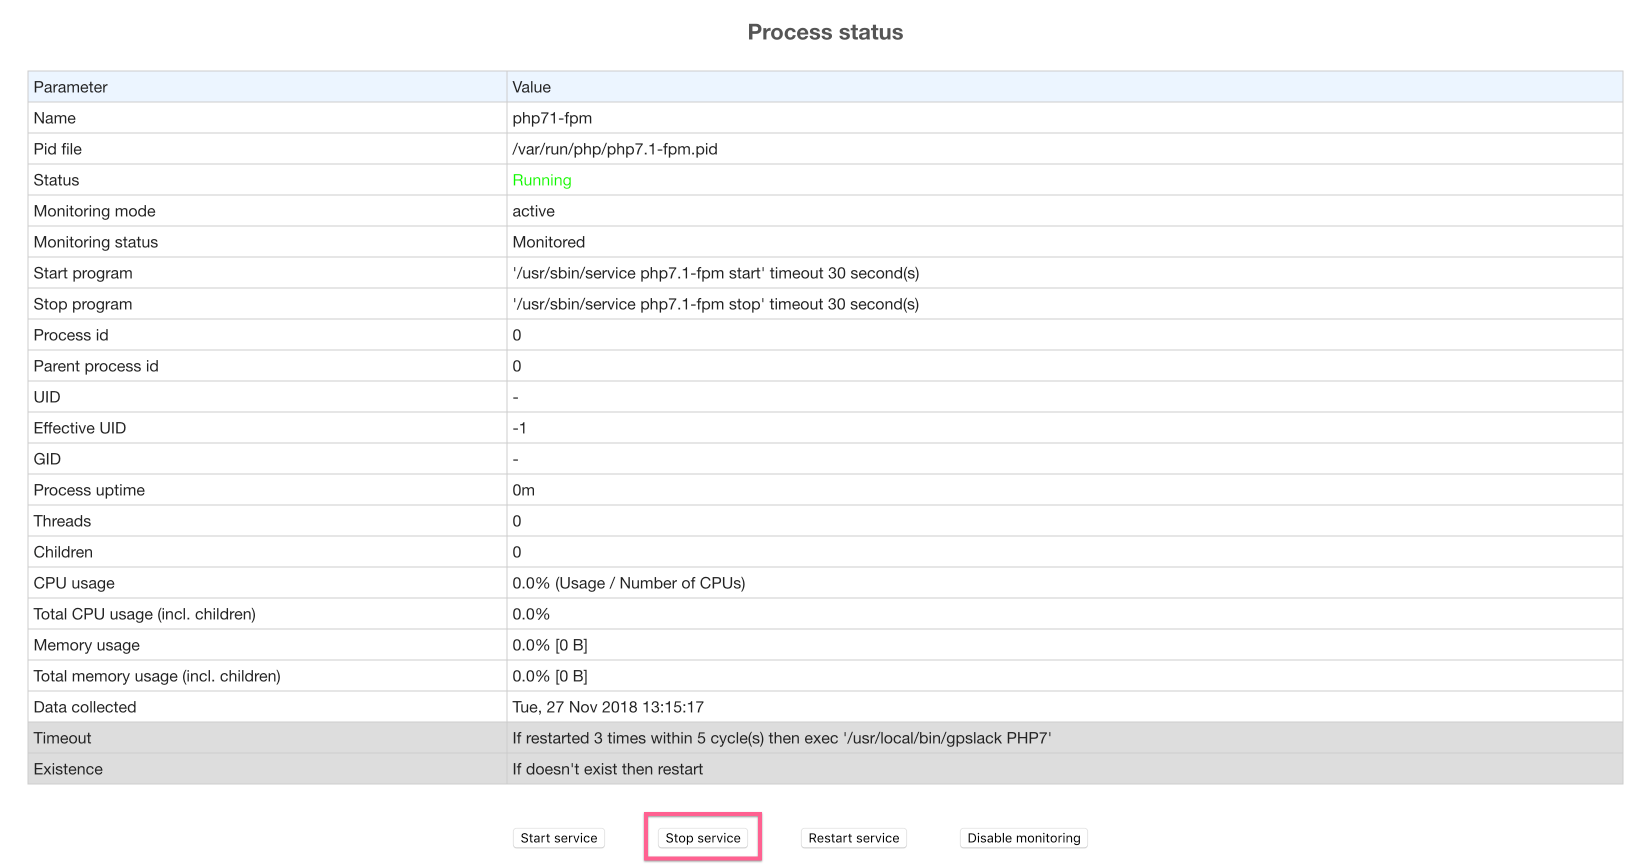
Remember though, if you are going to stop stack microservices, you need to ensure you restart them again before you try to use them.