Site Firewalls: ModSec

9 min read

Introduction

Developer plan accounts have access to the ModSecurity WAF for each of their sites on a GridPane managed server. We use the full OWASP foundation 3+ Core Ruleset (CRS) to protect your sites from a wide array of attack vectors including:

  • SQL Injection (SQLi)
  • Cross-Site Scripting (XSS)
  • Local File Inclusion (LFI)
  • Remote File Inclusion (RFI)
  • PHP Code Injection
  • Java Code Injection
  • HTTPoxy
  • Shellshock
  • Unix/Windows Shell Injection
  • Session Fixation
  • Scripting/Scanner/Bot Detection
  • Metadata/Error Leakages 

Table of Contents

  1. Enabling/Disabling ModSec WAF
  2. Adjusting ModSec WAF Sensitivity
  3. Audit Logging
  4. Adding Exceptions and Tuning the Core Ruleset

Enabling/Disabling ModSec WAF

The firewall can easily be enabled or disabled directly inside your account.

First, head over to the Sites page and click on the name of the website you wish to edit to open up the website customizer.

You’ll find the WAF options inside the security tab. Click through to ModSec and here you’ll find the toggle to enable or disable the ModSec WAF:

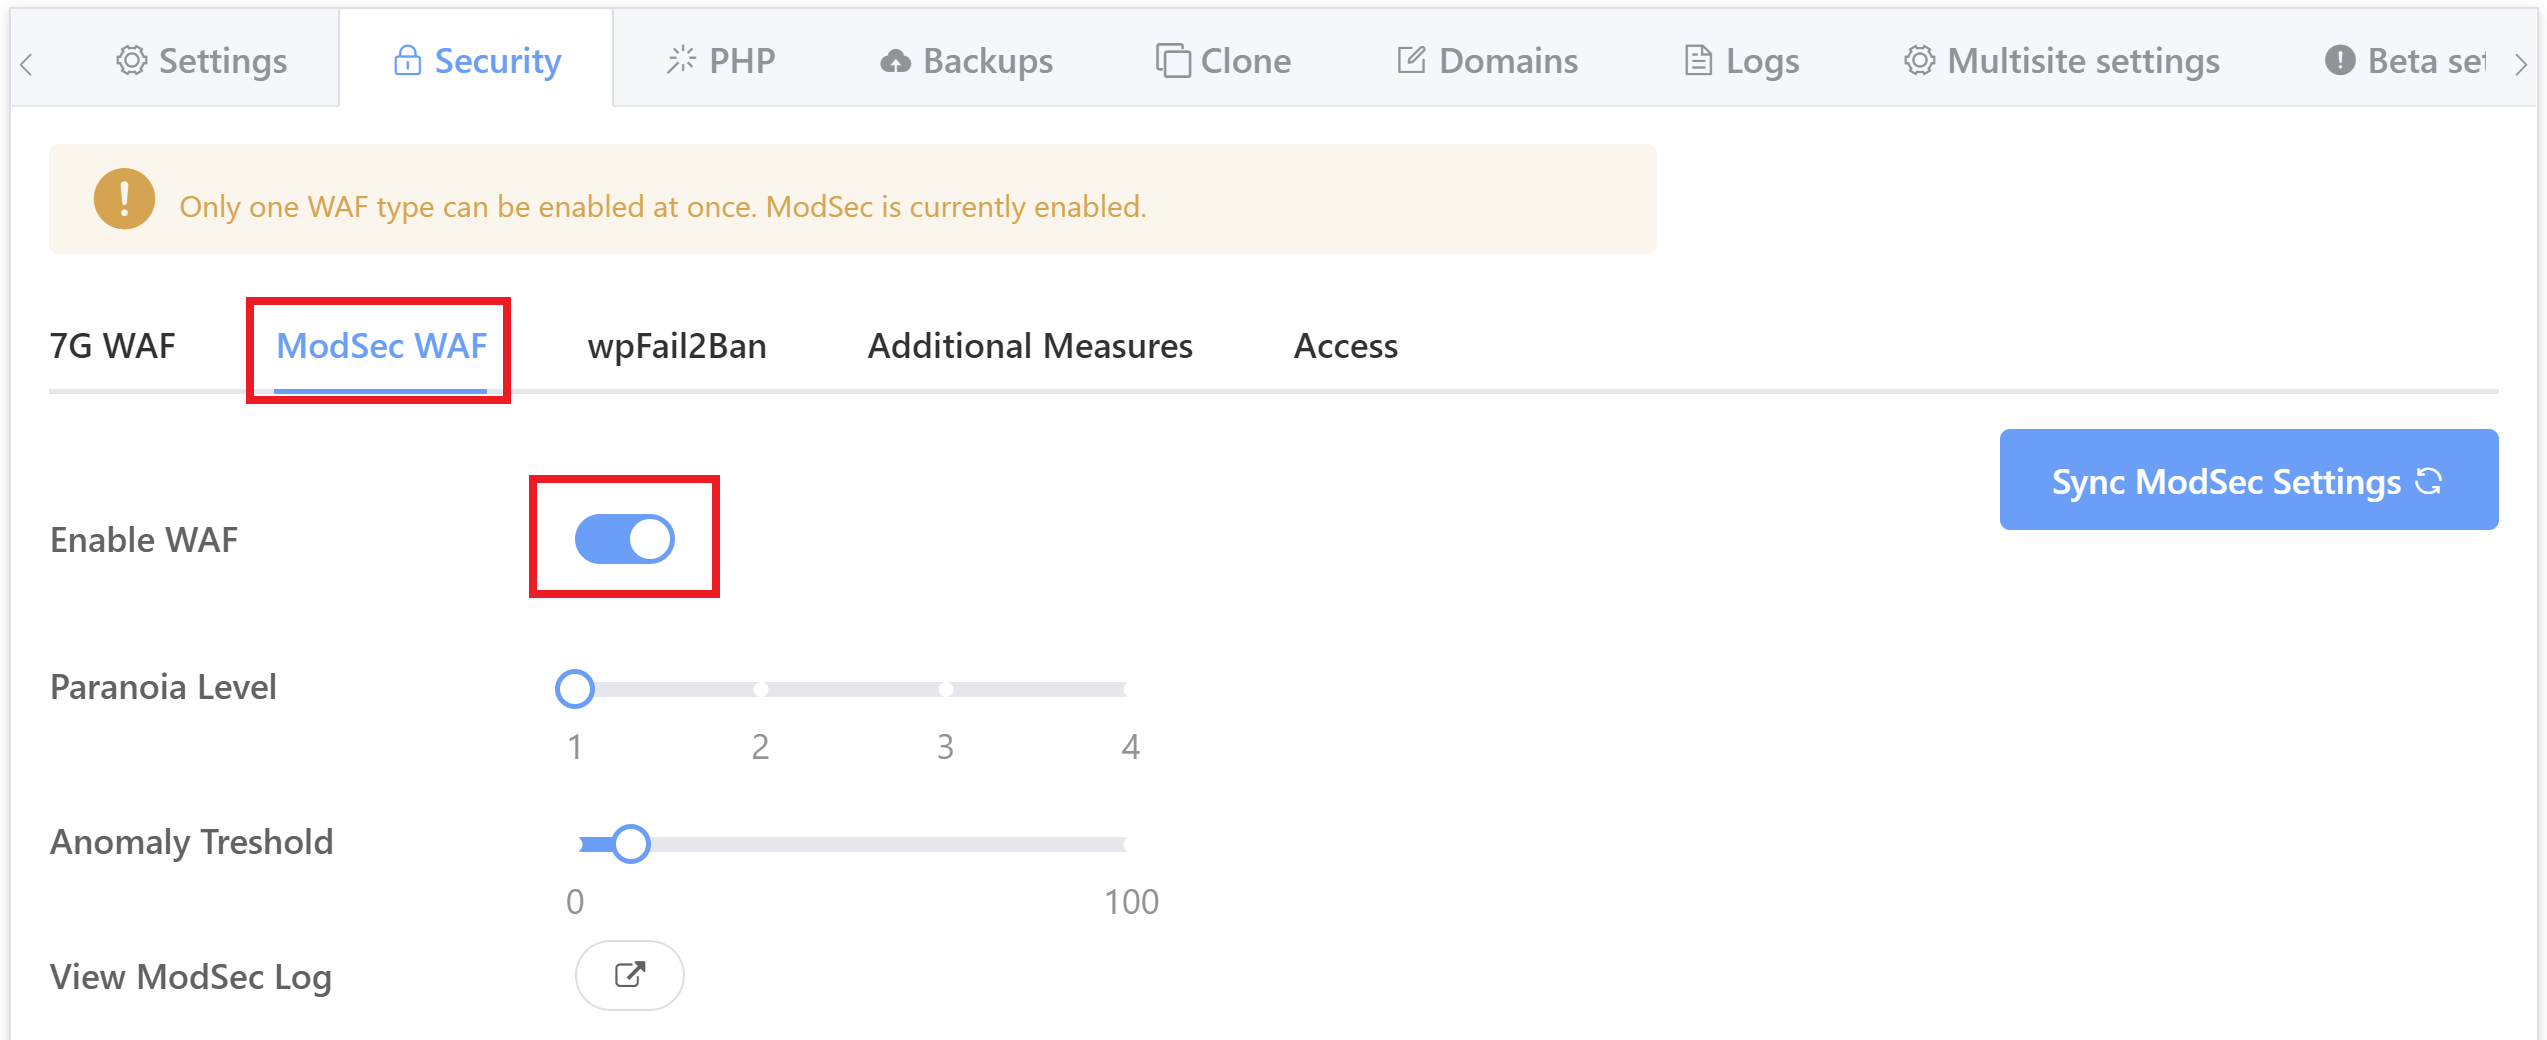
Note that you can only activate one WAF at a time, so if you have another turned on, you’ll first need to deactivate it to enable ModSec.

Turn on ModSec WAF via CLI

Enable the ModSec firewall where {site.url} is your WordPress site’s primary domain.

gp site {site.url} -modsec-on

Turn off Modsec WAF via CLI

Disable the ModSec firewall where {site.url} is your WordPress site’s primary domain.

gp site {site.url} -modsec-off

Adjusting ModSec WAF Sensitivity

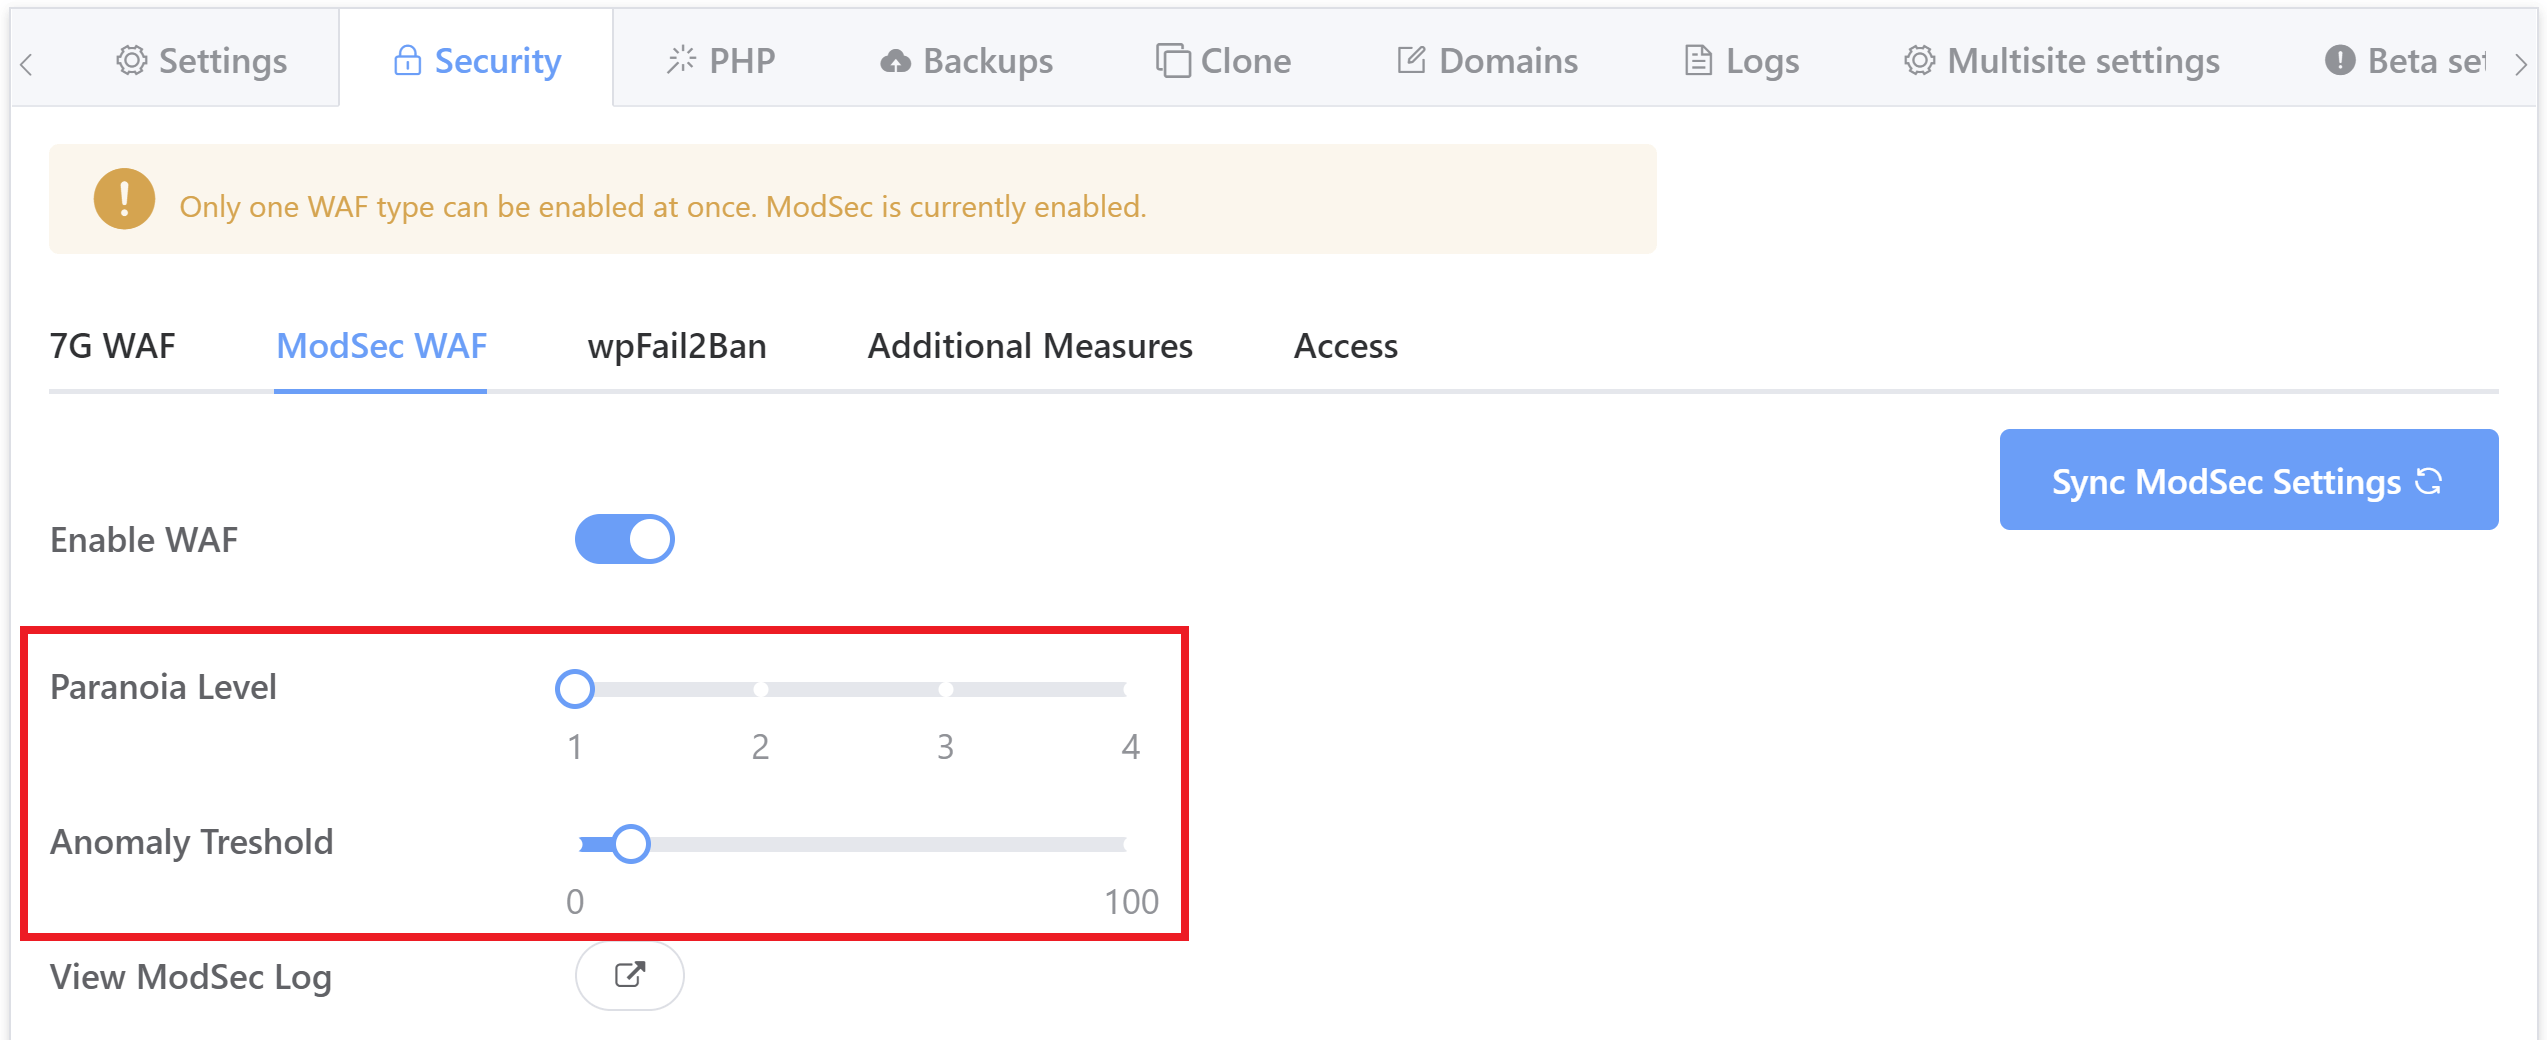
The ModSec Waf can be tuned per site by adjusting two of its configuration values, the Paranoia Level and the Anomaly Threshold. This can also be done directly inside your GridPane account as well as via CLI (details below).

Setting the Paranoia Level

Adjusting the the Modsec paranoia level where {site.url} is your WordPress site’s primary domain and the paranoia level  accepts an integer from 1 to 4

gp site {site.url} -modsec -paranoia-level {1-4}

The Paranoia Level (PL) setting allows you to choose the desired level of rule checks, the least paranoid level of checking is 1 to the maximum paranoia level of 4.

With each paranoia level increase, the CRS enables additional rules giving you a higher level of security. However, higher paranoia levels also increase the possibility of blocking some legitimate traffic due to false alarms (also named false positives or FPs). If you use higher paranoia levels, it is likely that you will need to add some exclusion rules for certain requests and applications receiving complex input.

Paranoia Level 1 is default. In this level, most core rules are enabled. PL1 is advised for beginners, installations covering many different sites and applications, and for setups with standard security requirements. At PL1 you should face FPs rarely. If you encounter FPs, please open an issue on the CRS GitHub site and don’t forget to attach your complete Audit Log record for the request with the issue.

Paranoia level 2 includes many extra rules, for instance enabling many regexp-based SQL and XSS injection protections, and adding extra keywords checked for code injections. PL2 is advised for moderate to experienced users desiring more complete coverage and for installations with elevated security requirements. Setting Paranoia Level 2 will likely cause some FPs which you will need to handle.

Paranoia level 3 enables more rules and keyword lists, and tweaks limits on special characters used. PL3 is aimed at users experienced at the handling of FPs and at installations with a high-security requirement.

Paranoia level 4 further restricts special characters. The highest level is advised for experienced users protecting installations with very high security requirements. Running PL4 will likely produce a very high number of FPs which have to be treated before the site can go production live.

Rules in paranoia level 2 or higher will log their PL to the audit log. This allows you to deduct from the audit log how the WAF behavior is affected by the increased paranoia level. for example:

[tag "paranoia-level/2"]

Setting the Anomaly Threshold

Adjusting the the Modsec paranoia level where {site.url} is your WordPress site’s primary domain and the paranoia level  accepts an integer.

gp site site.com -modsec -anomaly-threshold {integer}

The anomaly threshold is where you can specify at which cumulative anomaly score an inbound request, or outbound response, gets blocked. Most detected inbound threats will give a critical score of 5.

Smaller violations, like violations of protocol/standards, carry lower scores.

GridPane Default anomaly threshold is set to a value of 10, this means a request would require at least two critical alerts or a combination of many lesser alerts to reach the blocking threshold.

You can adjust this to suit your needs or while tuning the firewall for your site. Setting this value to 5 would result in the firewall blocking any request that gives a single critical score, while a value of 7 would require a critical score plus a smaller violation.

You can increase your threshold to allow for a less secure firewall, however in such circumstances some attacks may bypass the CRS rules or your own configured policies. Having said that it is a common practice to start a fresh CRS installation with elevated anomaly scoring thresholds (>100) and then lower the limits as your confidence in the setup grows.

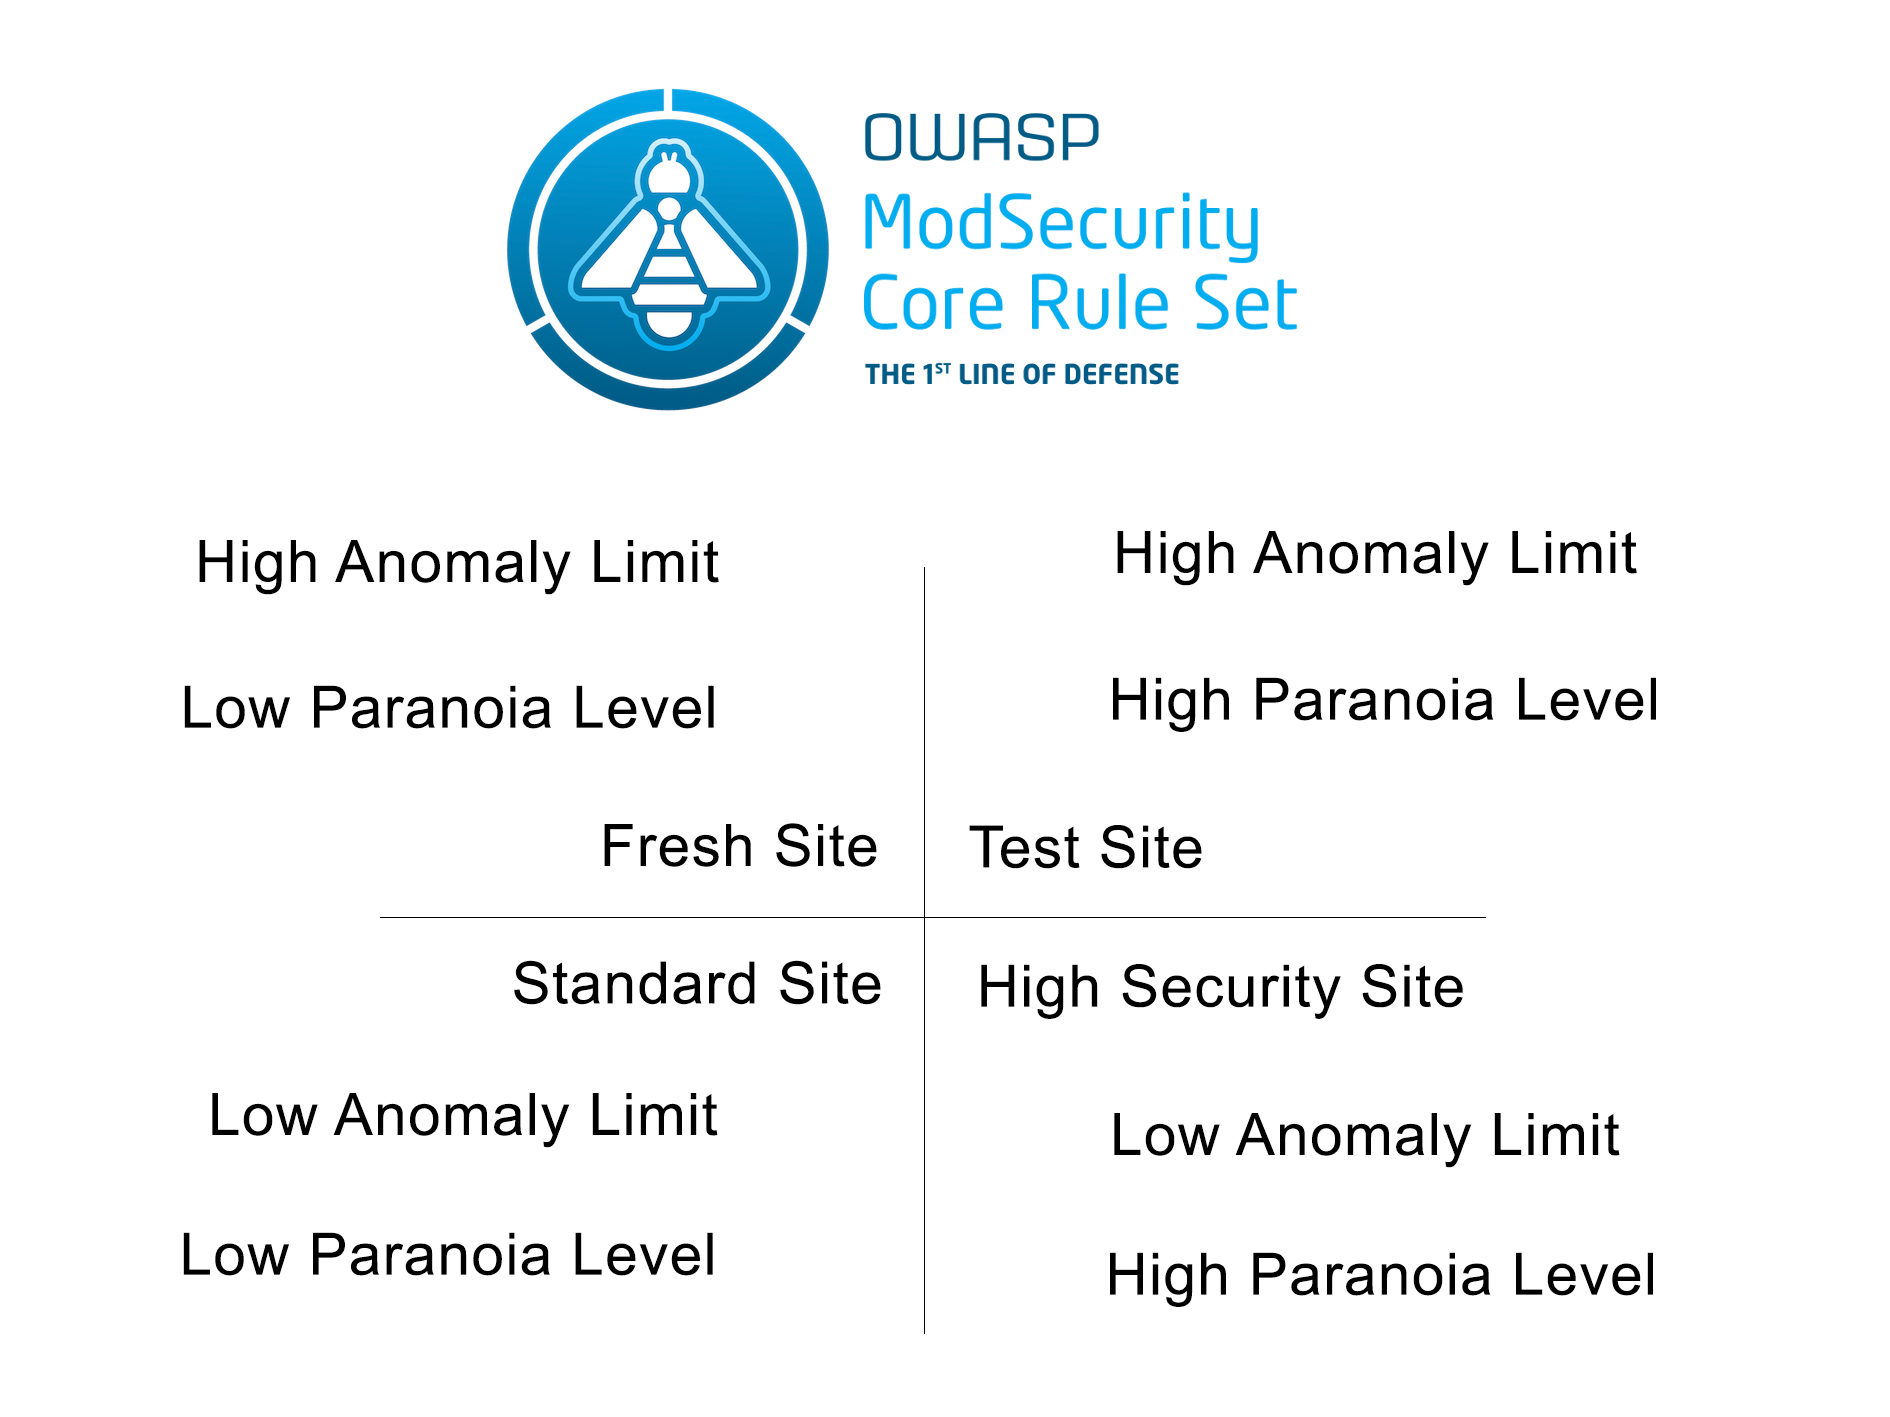
Anomaly Threshold / Paranoia Level Quadrant

Audit Logging

When a request has been blocked by ModSec it will generate an error in the Nginx Error log, available from your logs tab. Here is a typical example, where UptimeRobot user-agent has been blocked:

2019/12/31 16:56:42 [error] 11005#11005: *30442 [client 127.0.0.1] ModSecurity: Access denied with code 403 (phase 1). Matched "Operator `Eq' with parameter `1' against variable `IP:127.0.0.1_1c3991a2733b4c8a7a0286a4800ab4a5a7376e46::::DOS_BLOCK' (Value: `1' ) [file "/etc/nginx/modsec/owasp/rules/REQUEST-912-DOS-PROTECTION.conf"] [line "123"] [id "912130"] [rev ""] [msg ""] [data ""] [severity "0"] [ver ""] [maturity "0"] [accuracy "0"] [tag "application-multi"] [tag "language-multi"] [tag "platform-multi"] [tag "attack-dos"] [hostname "127.0.0.1"] [uri "/"] [unique_id "157892494257.867402"] [ref ""], client: 127.0.0.1, server: an-example.site, request: "HEAD / HTTP/1.1", host: "an-example.site", referrer: "http://an-example.site"

We can see ModSec has blocked this request, the rule that has lead to the block:

[file "/etc/nginx/modsec/owasp/rules/REQUEST-912-DOS-PROTECTION.conf"]

And the rule ID:

[id "912130"]

And importantly the timestamp:

2019/12/31 16:56:42

GridPane’s ModSec WAF is set up for concurrent logging, this allows for better performance and means each block has an individual report log file in a directory tree structure, with an index of all reports saved to the audit log.

The audit log index can be found on the following site specific filepath, where {site.url} is replaced by your site’s primary domain:

by SSH:

/var/www/{site.url}/modsec/modsec_audit.log

by SFTP

/sites/{site.url}/modsec/modsec_audit.log

In this audit log you will see entries for each block and its relevant report, with the filepath to the report (bold) and some other details of the blocking. We can use the timestamp from the Nginx error log to identify the report we want to investigate.

an-example.site 127.0.0.1 - [31/Dec/2019:16:56:42 +0000] "HEAD / HTTP/1.1" 403 0 https://an-example.site "Mozilla/5.0+(compatible; UptimeRobot/2.0; http://www.uptimerobot.com/)" 157892494257.867402 http://an-example.site /var/www/an-example.site/modsec/audit-logs/audit/20191231/20191231-1656/20191231-165642-157892494257.867402 0 912.000000 md5:961e06ade83aa9d7b76e32cfd0fa2646

In that index line, this is the filepath to the individual log report:

http://an-example.site /var/www/an-example.site/modsec/audit-logs/audit/20191231/20191231-1656/20191231-165642-157892494257.867402

We can view the log in our terminal:

cat  /var/www/an-example.site/modsec/audit-logs/audit/20191231/20191231-1656/20191231-165642-157892494257.867402

And get the full report:

---uGAklyhg---A--
[31/Dec/2019:16:56:42 +0000] 157892494257.867402 127.0.0.1 39814 127.0.0.1 8080
---uGAklyhg---B--
HEAD / HTTP/1.1
User-Agent: Mozilla/5.0+(compatible; UptimeRobot/2.0; http://www.uptimerobot.com/)
X-Forwarded-Proto: https
Connection: close
X-Original-Host: an-example.site
X-Forwarded-For: 63.143.42.243
X-Real-IP: 63.143.42.243
Content-Length: 0
X-Original-Scheme: https
accept-encoding: gzip, deflate
HTTPS: on
Referer: http://an-example.site
Host: an-example.site
Accept: text/html,application/xhtml+xml,application/xml;q=0.9,*/*;q=0.8
cache-control: no-cache
Accept-Language: en-US,en;q=0.8
Accept-Charset: ISO-8859-1,UTF-8;q=0.7,*;q=0.7

---uGAklyhg---D--

---uGAklyhg---F--
HTTP/1.1 403
Server: nginx
Date: Mon, 31 Dec 2019 16:56:42 GMT
Content-Length: 146
Content-Type: text/html
Connection: close

---hyHQa6IL---H--

---hyHQa6IL---I--

---hyHQa6IL---J--

---hyHQa6IL---Z--

You can find more details on the sections of a report and their different possible content in the ModSecurity handbook here.

Adding Exceptions and Tuning the Core Ruleset

The ModSec firewall can be tuned with exceptions and whitelists, more details can be found here.

Exceptions versus Whitelist

There are two generally different methods for modifying rules. Exceptions, which will remove or modify the rule from startup time and whitelist modifications which can modify a rule based on the content of a transaction. In general whitelist rules are slightly more powerful but also more expensive as they must be evaluated every time a transaction comes in.

You can create serverwide exceptions that will work across all sites by putting your rules in this file on the server, it will load these up before loading in the security rules:

/etc/nginx/modsec/owasp/rules/REQUEST-900-EXCLUSION-RULES-BEFORE-CRS.conf

Alternatively, you can create site specific exceptions and whitelists using the following two files, replacing {site.url} with your site’s primary domain:

/var/www/{site.url}/modsec/{site.url}-runtime-exceptions.conf
/var/www/{site.url}/modsec/{site.url}-runtime-whitelist.conf

Crafting a rule

In the above logging example we saw that the firewall was blocking Uptime Robot. We have the ID of the rule that was triggering the block, 912130, and in the report we have a bunch of detail we can use to whitelist these requests.

We could target the User-Agent, but this is easy to spoof, so instead we are going to use the X-Real-IP that has been passed through to the Nginx backend from our reverse proxy. We can confirm that the IP 63.143.42.243 belongs to UptimeRobot and then check the REQUEST_HEADERS for this value.

Add a rule in the /var/www/{site.url}/modsec/{site.url}-runtime-whitelist.conf like so:

SecRule REQUEST_HEADERS:X-Real-IP "@Contains 63.143.42.243" 
    "id:3,
    phase:1,
    nolog,
    allow,
    pass,
    ctl:ruleRemoveById=912130"

Check Nginx syntax and reload:

gp ngx -t && gp ngx reload

So now when the Firewall detects a request is coming from the Uptime Robot Real IP it removes the rule that was preventing the external resources from connecting to the site, in this case  912130 is an anti aa-dos rule.