What Can “top” Show You?
top will display a real-time overview of what’s happening on your server. In a nutshell, you’ll be able to see the following at a glance: –
- System time, server up-time, and user sessions
- Load average
- System tasks breakdown
- Real-time CPU usage broken down into categories
- Real-time memory usage
- A list of active processes sorted by heaviest CPU usage (by default)
Part 1. The “top” Summary Area: What it All Means
The summary area at the beginning is the system overview. Below we’ll cover what each part means, section by section.
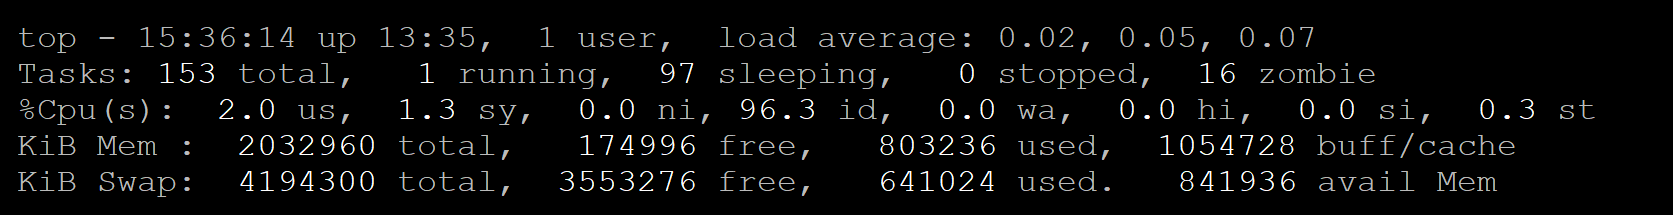
System time, server up-time, and user sessions
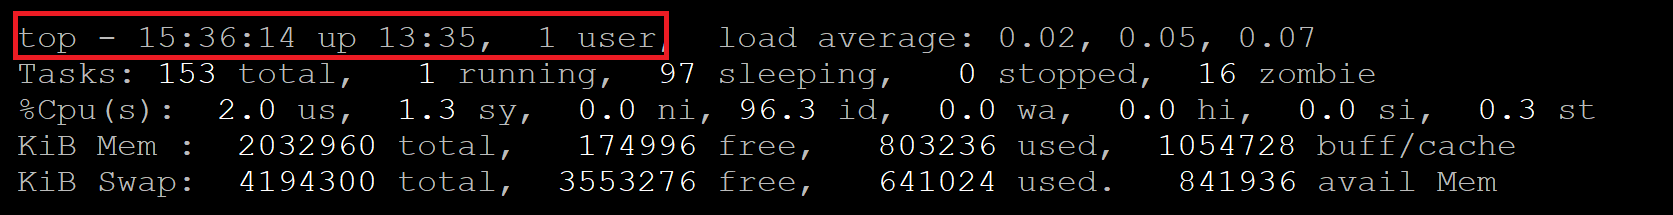
Here you can see the current system time, how long the server has been online, and the number of active user sessions. For our purposes, this isn’t particularly important.
Load average
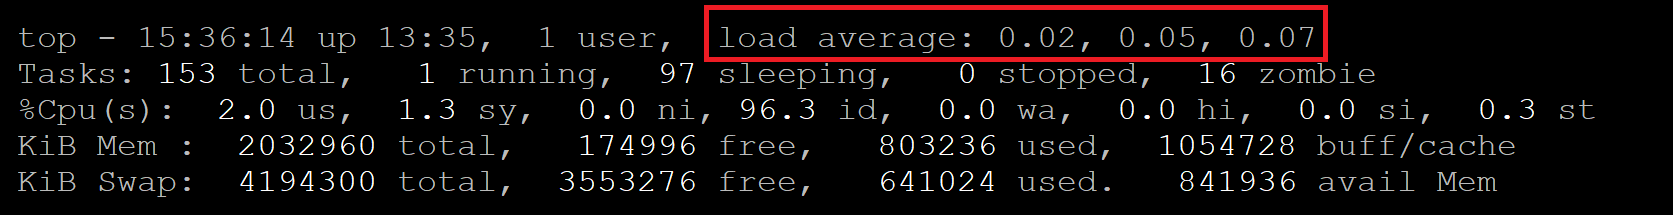
Here we can see the average “load” over one, five, and fifteen minutes.
Load is measured per CPU, so if you have more than one core, you will need to divide what you see by the number of cores your server is running.
For example, a load average of 0.5 on a single-core VPS means that the server is running at 50% capacity – 50% of the CPU is free, and the other is running tasks. A value of 2.5 would mean the server is overloaded with 150% more work than it can process.
On a two-core VPS, 0.5 would mean 50% of one core, which means the server is at 25% capacity and able to take on 75% more work. An average of 2 would mean 200% – 100% of each of its cores – so that VPS would be at 100% capacity.
Sustained, high load times mean your server is consistently busy. This could be due to a number of reasons, such as high website traffic or a brute force attack. The rest of the data provided by top should help fill in the gaps.
System tasks breakdown
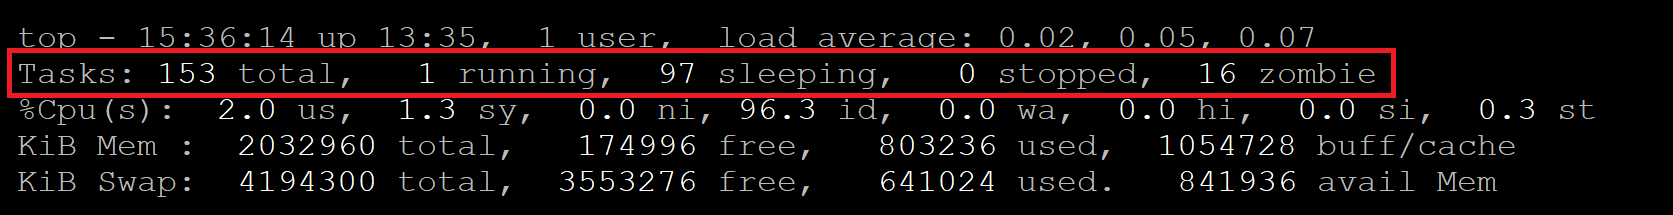
For clarity, Tasks and Processes for our purposes are the same things. Here we have 153 total processes.
- Running: This is the number of tasks ready/currently being executed by the CPU
- Sleeping: The number of processes waiting for an event or I/O task to complete
- Stopped: The number of processes that have been stopped
- Zombie: These are leftover parts of processes that have already been completed but haven’t cleaned up after themselves properly.
If you check top regularly, tasks can be a good indicator of how busy your system is.
Real-time CPU usage is broken down into categories
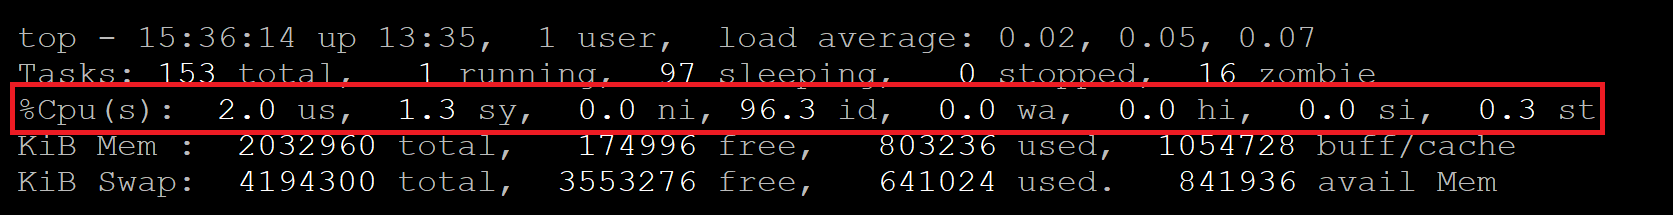
CPU usage is the primary metric we’re interested in.
The higher your %Cpu, the busier your system is, and this will affect the performance of your websites.
Bursts of high usage are normal and nothing to be concerned about. Sustained high CPU usage is something that requires further attention.
The following is a quick explanation of what each of these values means.
User (us)
This is the CPU time used by userspace processes. These are your application-level processes, such as MySQL. This is going to be the biggest user of CPU.
System (sy)
This shows the amount of CPU time used by the kernel. The kernel is responsible for low-level tasks that take care of your general day-to-day server processes, e.g. operating system processes.
This can spike when data is being read or written to disk. Sustained high usage may indicate a device driver issue.
Nice (ni)
This is a subset of the “user” state and shows the CPU time used by processes that have a positive niceness (those with a lower priority than other tasks).
The default value is 0, and it ranges from 19 down to -20. 19 is the lowest priority. -20 is the highest priority.
Idle (id)
Time spent in idle operations.
I/O Wait (wa)
Time spent on waiting on IO peripherals, usually disk.
Hardware interrupt (hi)
Time spent servicing hardware interrupt routines. These require immediate CPU attention.
Software interrupt (si)
Time spent servicing software interrupt routines.
Steal (st)
Steal only applies to virtual machines, not dedicated servers. Sustained steal can be a serious problem as it means that other instances on the shared server are stealing away from your allocation, which may cause performance issues.
Real-time memory usage
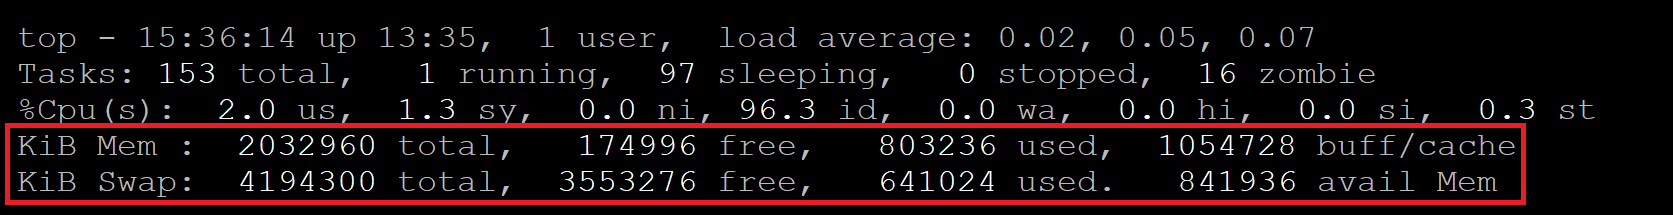
This section shows information regarding the memory usage of the system. We have RAM and Swap – Swap is part of your hard disk that’s used by your server like it uses RAM. This is why having spare disk space is important for your system and why performance issues can arise when your disk space usage gets past 90%. If you use software such as Photoshop, Illustrator, or other heavy Adobe Creative Cloud apps, you’ll likely have experienced the same thing on your computer.
total, free, and used values are pretty much self-explanatory.
“buff/cache” are two different things lumped into one. Buff is data that’s in the process of being written, and this cannot be reallocated. Cache is data that’s been read and can be reallocated if needed.
“avail mem” is the amount of available memory that can be used without causing more swapping.
Swap space is your safety net if you run out of RAM. High swap and RAM usage will affect your system’s ability to process tasks efficiently, potentially resulting in 504 time-out errors. Processes will get slower and backed up while they wait for memory to become available.
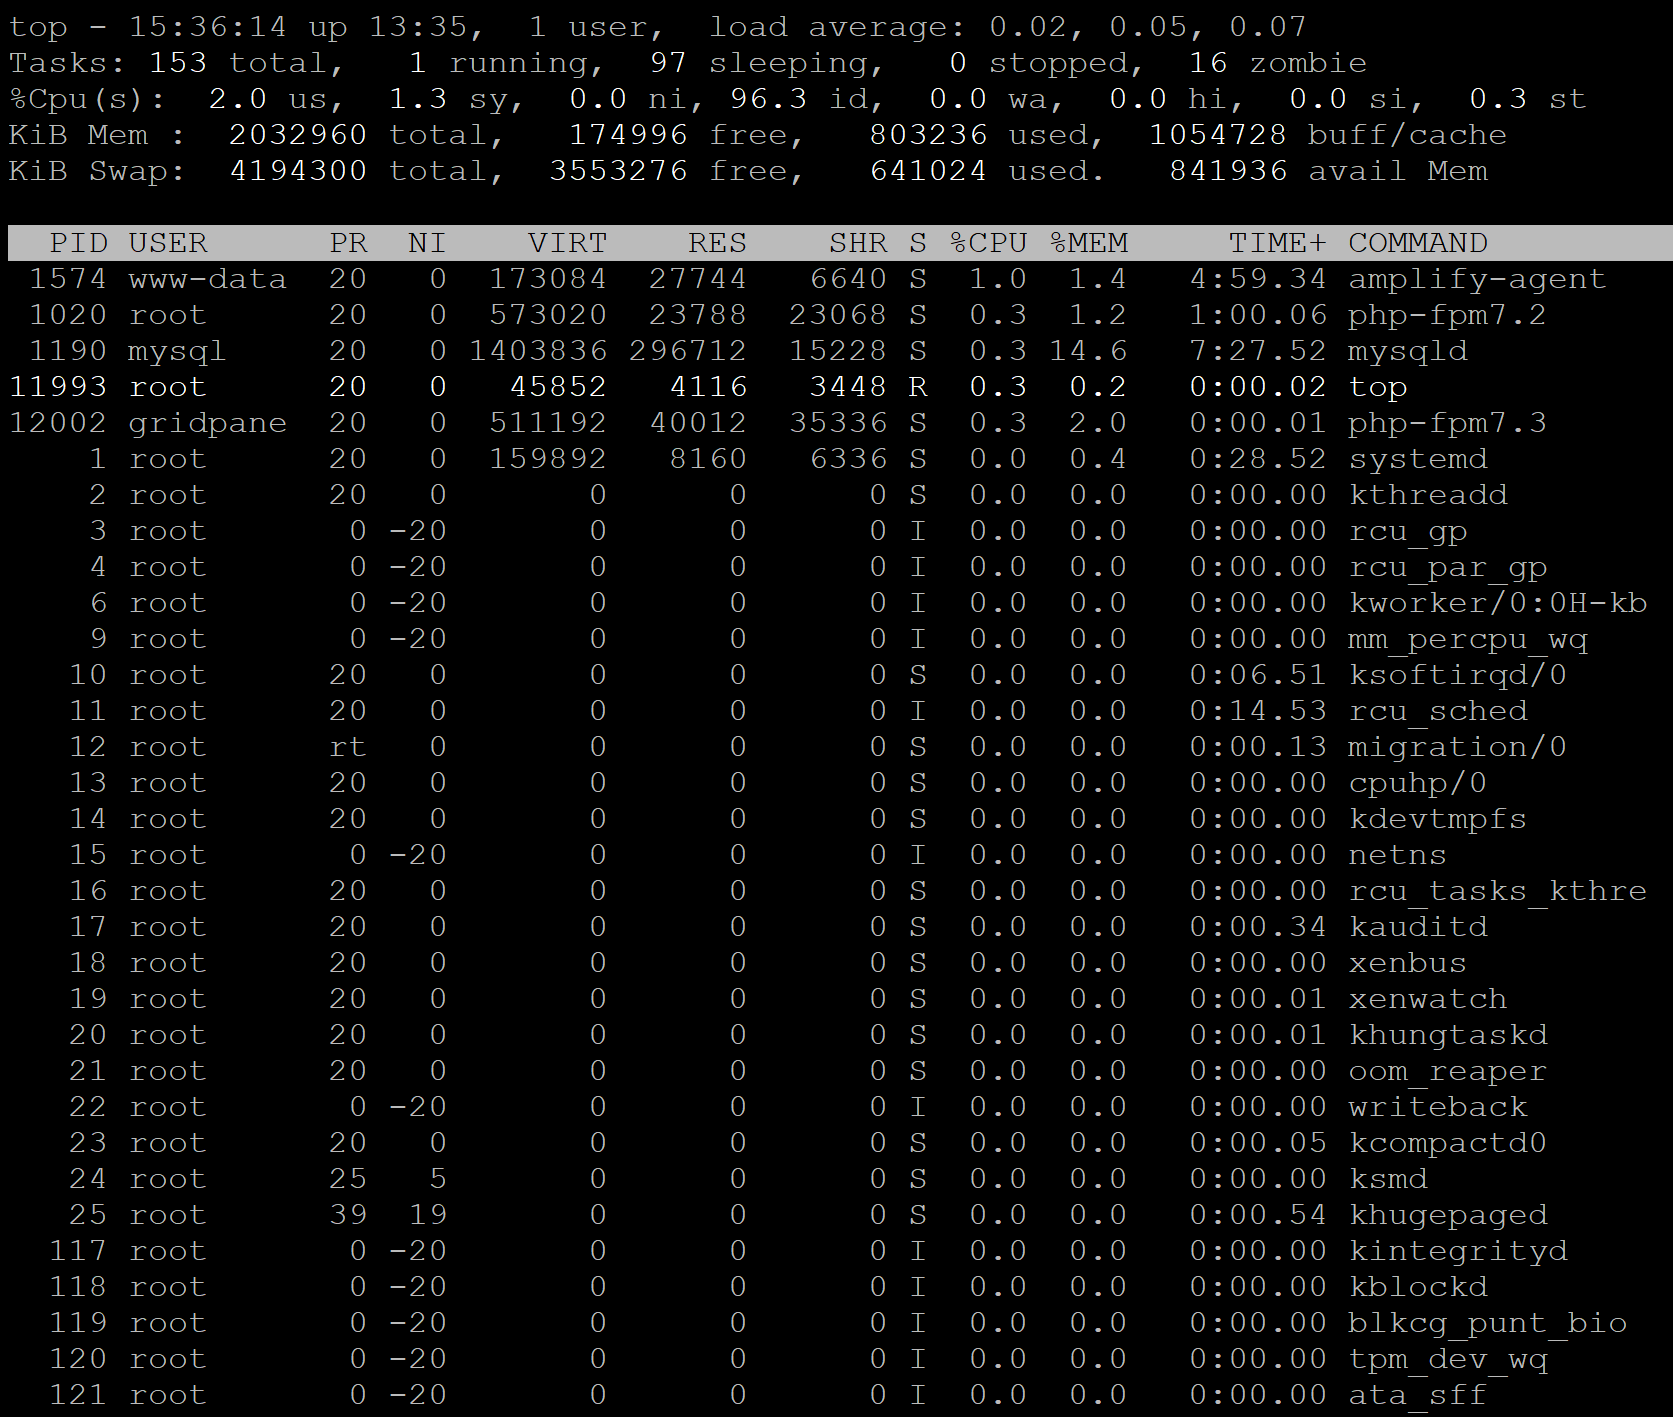
Part 2. Active Processes
So you now have an overview of what’s happening on your server at a glance. If you’re seeing high resource usage on your server, we now need to look at the processes themselves to see what’s responsible.
The active process list is the lower part of the overview and is sorted by CPU usage by default – the highest running processes at the top. This is highlighted below:
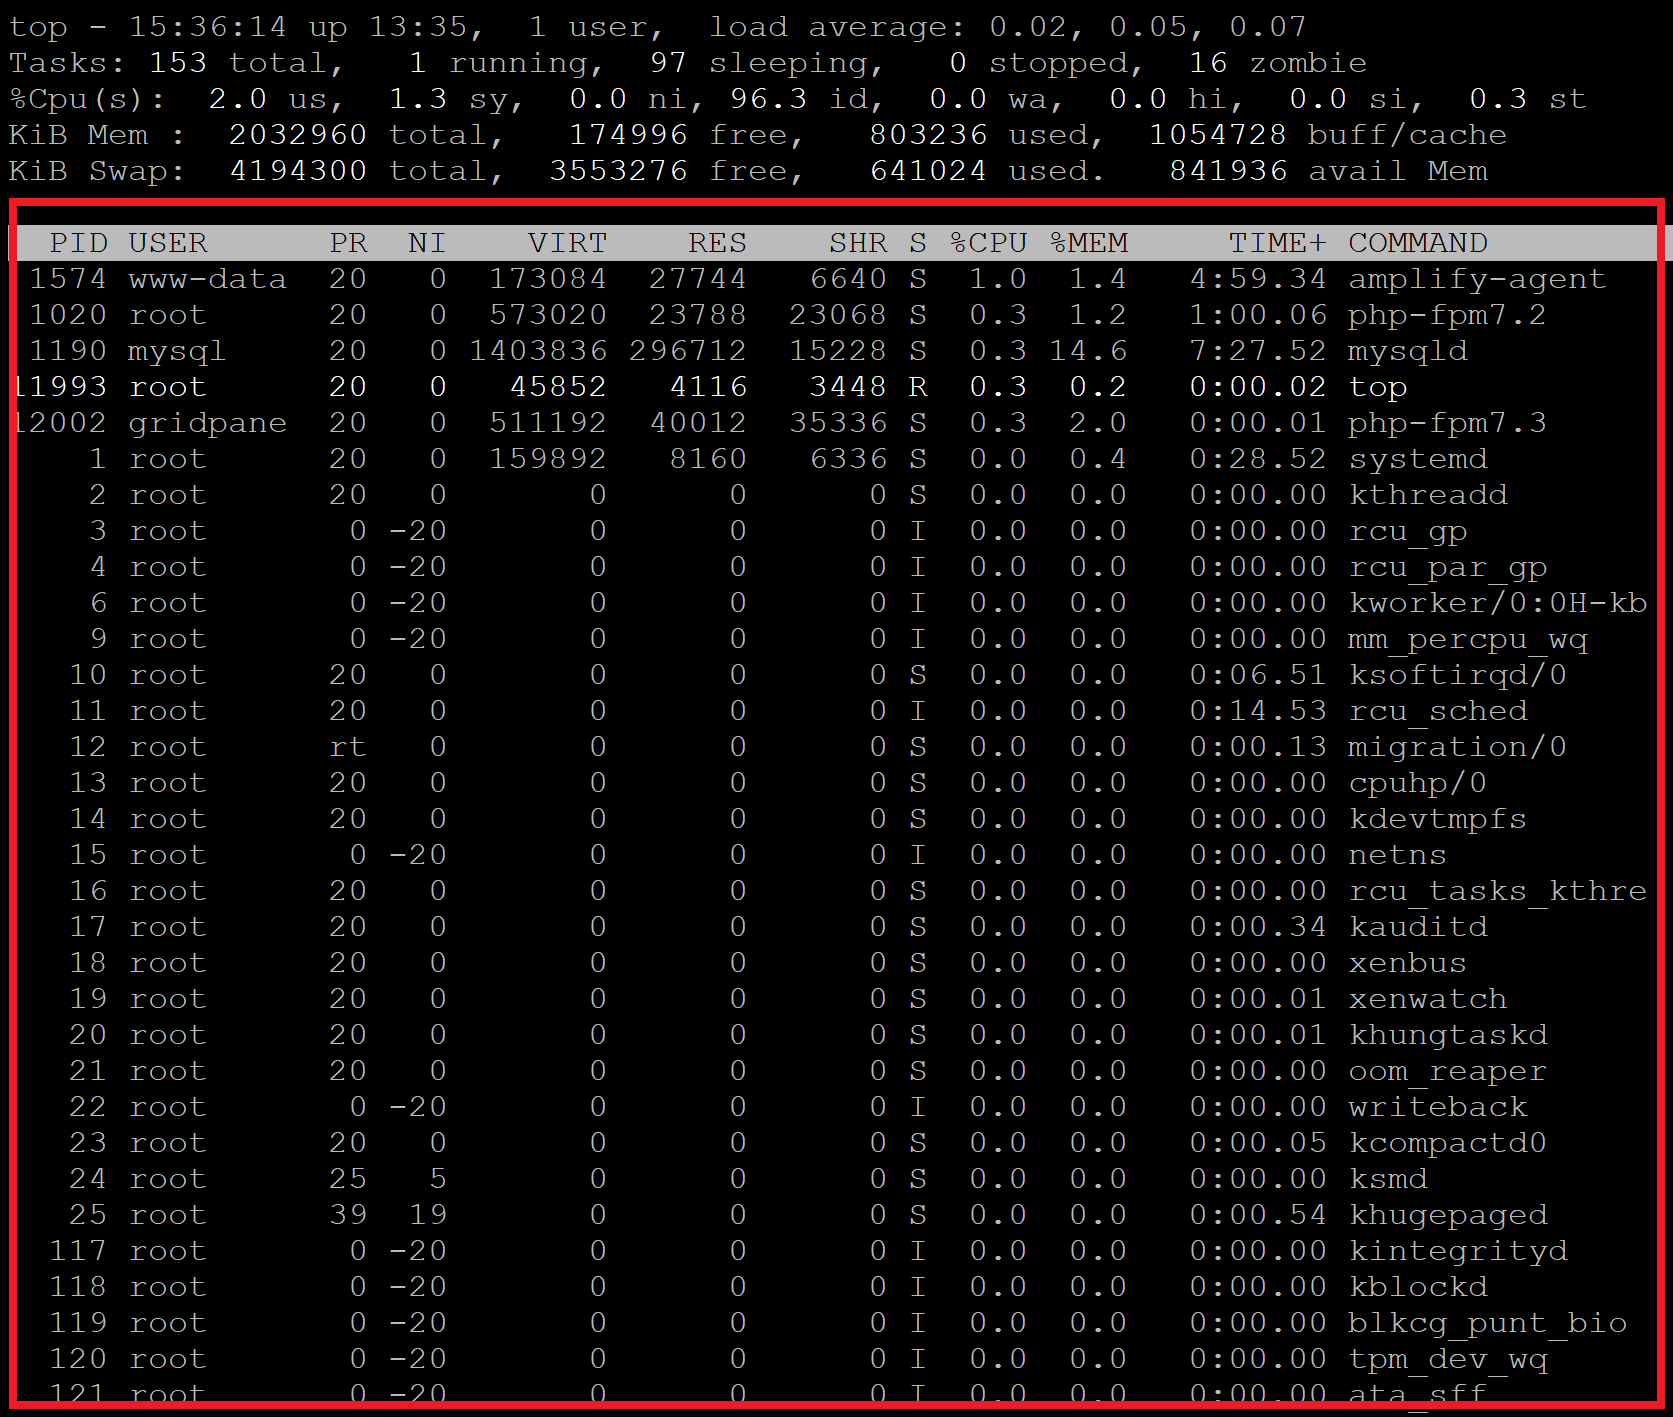
Below is a quick breakdown of what each column displays: –
- PID: Displays a task’s unique process ID
- USER: The username of the user who started the task
- PR: Shows the scheduling priority of the task.
- NI: Represents the nice value of the task. We covered this above in the CPU section in part 2. Nice effects a task’s priority – 19 being the lowest priority, -20 being the highest
- VIRT: Shows the total amount of memory used by the task.
- RES: Shows the memory consumed by the process in RAM
- SHR: Represents the amount of shared memory (in kb) used by the task
- %CPU: Represents the CPU usage
- %MEM: Shows the percentage of total available RAM used by the task
- TIME+: The total amount of CPU Time used by the task, shown in hundredths of a second.
- COMMAND: The name of the running process
I/O Wait
Second, are you experiencing high iowait? If this is high, then the CPU is waiting on the IO/drives. You can exit top and install and run iotop to see which process is causing the most I/O utilization on your server.
To exit top hit Ctrl+C.
You can install iotop with:
apt install iotop
Then run:
iotop
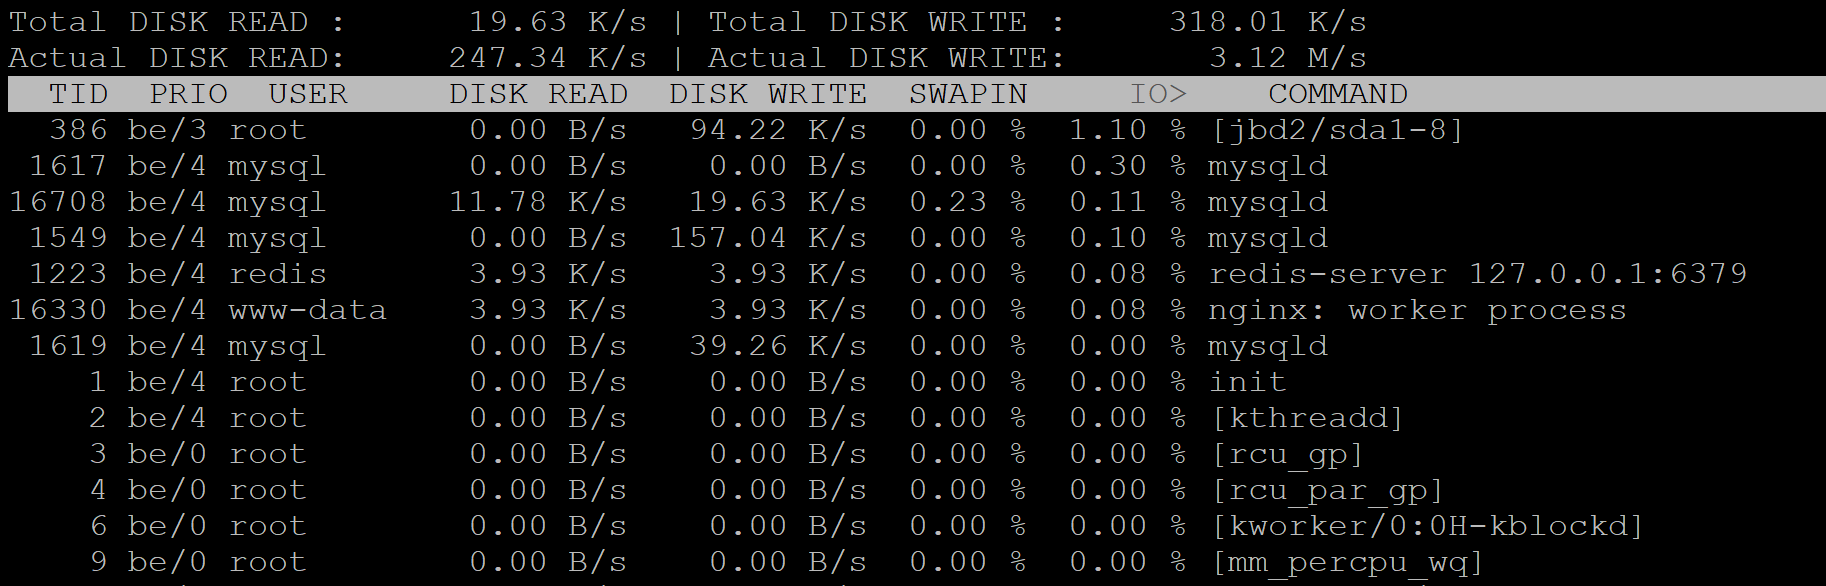
iotop will list all of the processes running, with the heaviest process at the very top.
To exit topor iotop hit Ctrl+C.